## Bar Chart: Annual Publication Count (1970-2024)
### Overview
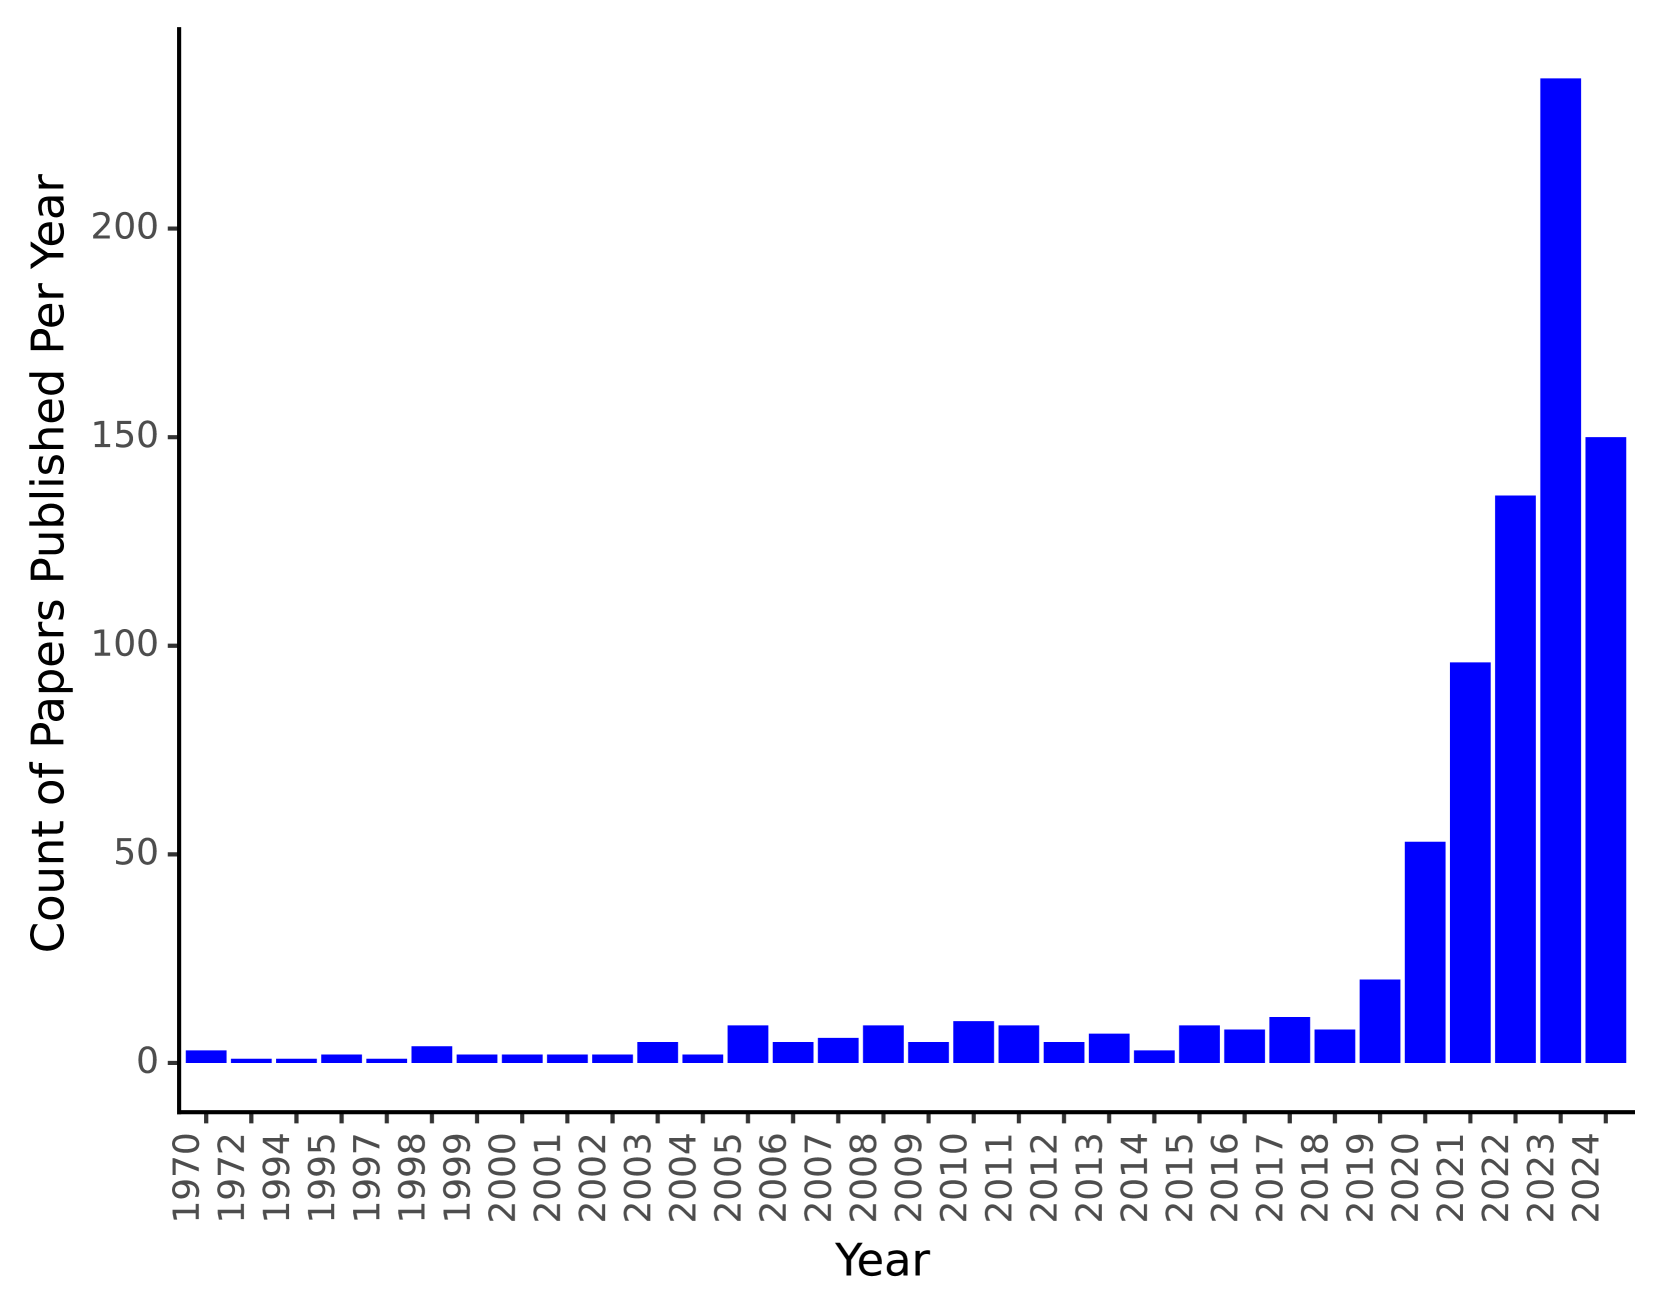
This is a vertical bar chart displaying the annual count of academic or research papers published over a period spanning from 1970 to 2024. The chart illustrates a dramatic, exponential increase in publication volume beginning in the late 2010s, culminating in a peak in 2023.
### Components/Axes
* **Chart Type:** Vertical Bar Chart.
* **X-Axis (Horizontal):**
* **Label:** "Year"
* **Markers:** Individual years are labeled vertically below each bar. The sequence is not continuous; it starts with 1970, then jumps to 1994 and continues annually from 1994 to 2024.
* **List of Year Labels (from left to right):** 1970, 1994, 1995, 1997, 1998, 1999, 2000, 2001, 2002, 2003, 2004, 2005, 2006, 2007, 2008, 2009, 2010, 2011, 2012, 2013, 2014, 2015, 2016, 2017, 2018, 2019, 2020, 2021, 2022, 2023, 2024.
* **Y-Axis (Vertical):**
* **Label:** "Count of Papers Published Per Year"
* **Scale:** Linear scale from 0 to over 200.
* **Major Tick Marks:** 0, 50, 100, 150, 200.
* **Data Series:** A single series represented by solid blue bars. There is no legend, as only one category of data is presented.
* **Visual Style:** The chart has a plain white background. The bars are a uniform, solid blue color. The axes are black lines.
### Detailed Analysis
The chart shows the number of papers published each year. Values are approximate, derived from visual estimation against the y-axis scale.
* **1970 - 2018 (Low-Activity Period):** Publication counts are consistently very low.
* **1970:** ~2 papers.
* **1994-2003:** Counts fluctuate between ~0 and ~5 papers per year. Several years (e.g., 1995, 1997, 2000, 2001) show bars at or near zero.
* **2004-2018:** A slight but noticeable increase begins. Annual counts generally range between ~5 and ~15 papers. The highest in this period appears to be 2017 at ~15 papers.
* **2019 - 2024 (Exponential Growth Period):** A sharp, sustained increase begins.
* **2019:** ~20 papers.
* **2020:** ~52 papers.
* **2021:** ~96 papers.
* **2022:** ~135 papers.
* **2023:** ~235 papers (the peak of the chart, significantly exceeding the 200 mark).
* **2024:** ~150 papers (a notable decrease from the 2023 peak).
### Key Observations
1. **Exponential Growth:** The most striking feature is the near-exponential growth in publications starting around 2019/2020. The count in 2023 is over 10 times higher than just four years prior in 2019.
2. **2023 Peak:** The year 2023 represents the clear maximum in the dataset, with a bar that is substantially taller than all others.
3. **2024 Decline:** There is a significant drop in the publication count for 2024 compared to 2023, though the 2024 level remains the second-highest on the chart.
4. **Historical Baseline:** For nearly five decades (1970-2018), the annual output was minimal, rarely exceeding 15 papers. This establishes a very low baseline against which the recent surge is measured.
5. **Data Gaps:** The x-axis labels are not continuous (e.g., missing 1971-1993, 1996). This suggests either no data was available for those years or the chart intentionally focuses on years with non-zero publications, though bars for some labeled years (like 1995) are also near zero.
### Interpretation
This chart likely tracks research output in a specific, emerging, or rapidly evolving field (e.g., a subfield of artificial intelligence, a new technology, or a recent scientific paradigm). The data suggests:
* **Field Emergence/Takeoff:** The field existed in a nascent state with sporadic publications for decades. A critical mass of interest, foundational breakthroughs, or enabling technologies around the late 2010s triggered an explosive growth phase.
* **Peak and Potential Saturation or Shift:** The peak in 2023 followed by a decline in 2024 could indicate several scenarios: a temporary dip, a correction after a period of intense activity, a shift in research focus within the broader field, or that 2024 data is incomplete (if the chart was created mid-year). It may also suggest the initial "hype cycle" peak has passed.
* **Research Momentum:** The sheer scale of growth from ~20 papers in 2019 to ~235 in 2023 indicates massive influx of attention, funding, and researchers into this area within a very short timeframe. This pattern is characteristic of "hot" topics in science and technology.
**In summary, the chart documents the transformation of a research topic from obscurity to a dominant, high-output area within half a decade, with 2023 marking its zenith of published activity as of the data's cutoff.**