## Bar Chart: Count of Papers Published Per Year (1970–2024)
### Overview
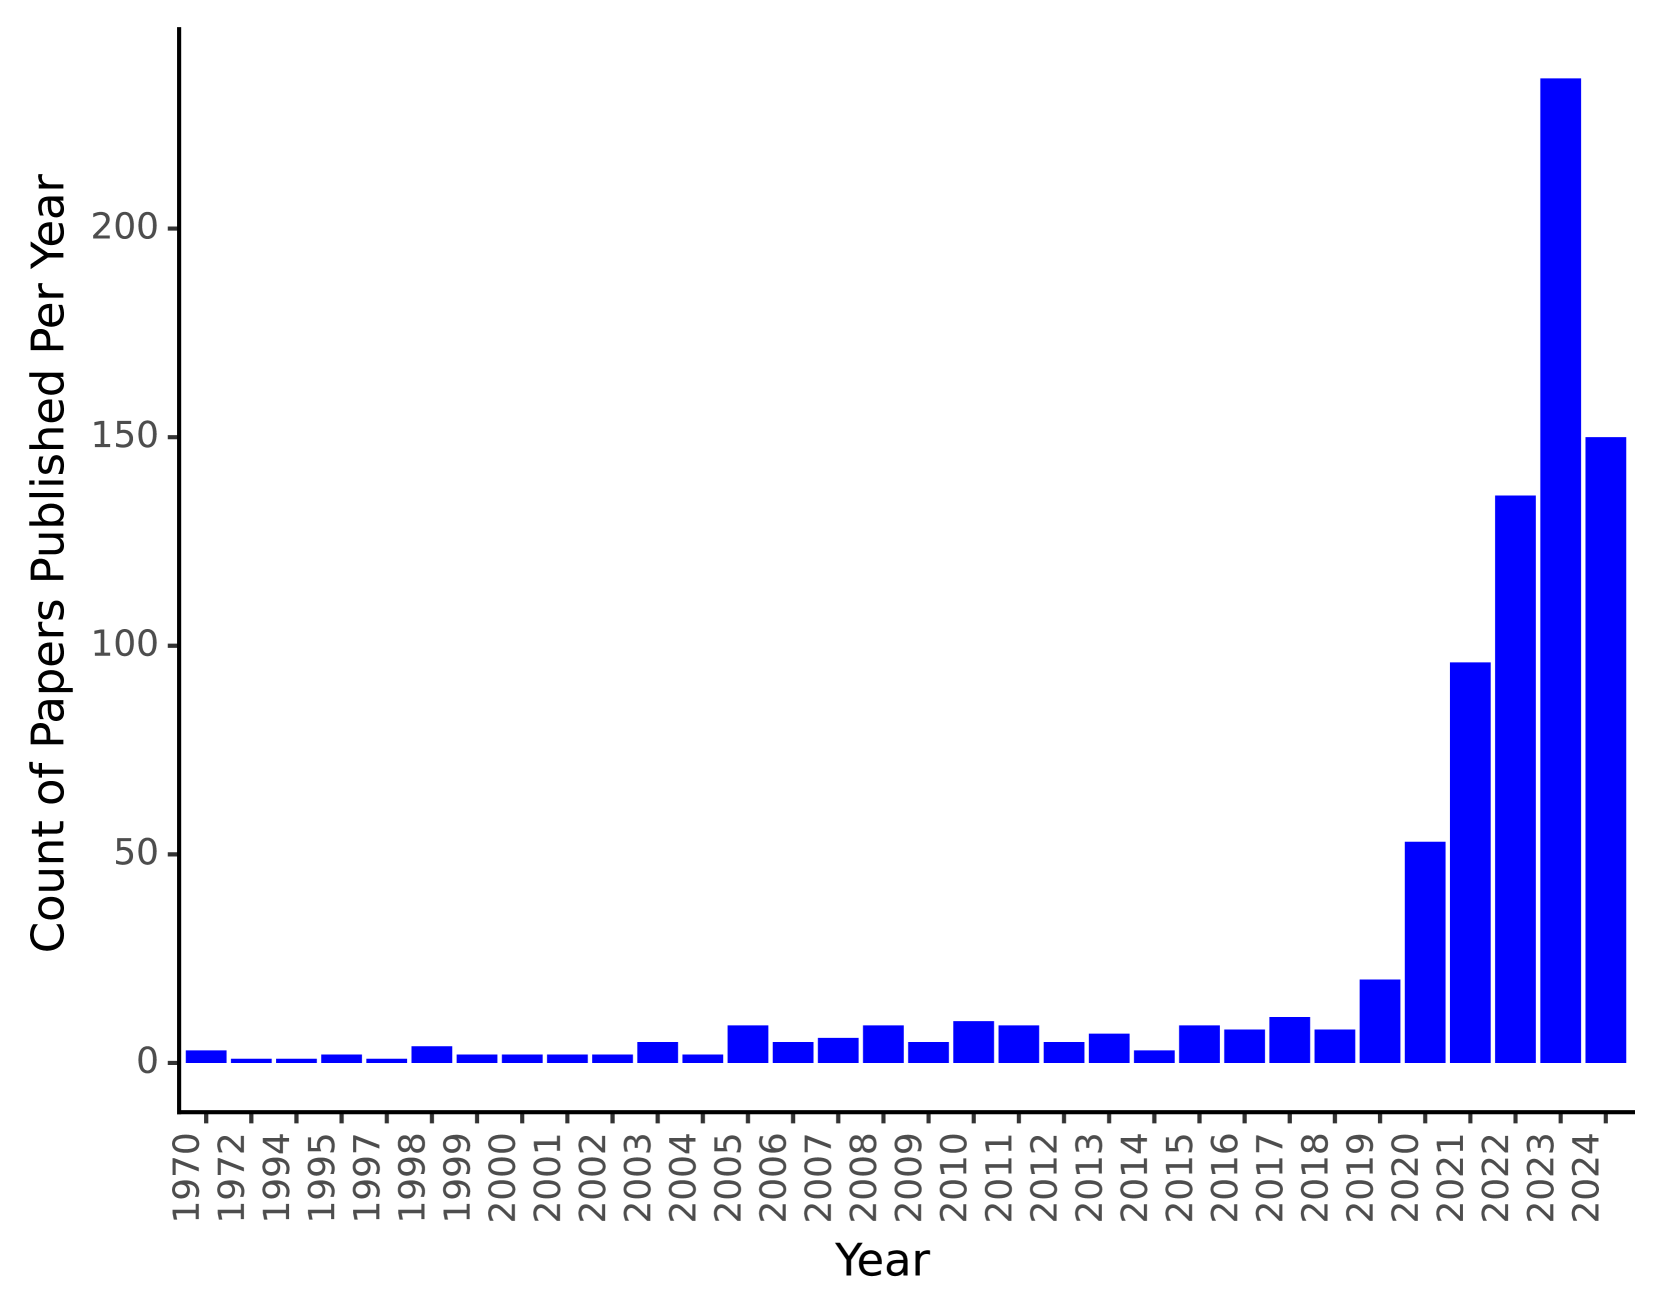
The chart visualizes the annual count of academic papers published from 1970 to 2024. Data is represented by blue bars, with a steady increase in publications over time, particularly accelerating after 2020.
### Components/Axes
- **X-axis (Year)**: Labeled "Year," with discrete markers for 1970, 1972, 1994, 1995, 1997, 1998, 1999, 2000, 2001, 2002, 2003, 2004, 2005, 2006, 2007, 2008, 2009, 2010, 2011, 2012, 2013, 2014, 2015, 2016, 2017, 2018, 2019, 2020, 2021, 2022, 2023, and 2024.
- **Y-axis (Count of Papers Published Per Year)**: Labeled "Count of Papers Published Per Year," scaled from 0 to 200 in increments of 50.
- **Legend**: A single blue color is used for the data series, labeled as "Count of Papers Published Per Year."
### Detailed Analysis
- **1970–2005**: Bars are minimal, with counts clustered between 0–5 papers per year. Notable exceptions include:
- 1998: ~5 papers.
- 2005: ~10 papers.
- **2006–2019**: Gradual growth, with counts ranging from 5–20 papers per year. Peaks include:
- 2010: ~15 papers.
- 2019: ~20 papers.
- **2020–2024**: Exponential surge:
- 2020: ~95 papers.
- 2021: ~95 papers.
- 2022: ~135 papers.
- 2023: ~230 papers (highest value).
- 2024: ~150 papers (sharp decline from 2023).
### Key Observations
1. **Steady Growth**: Publications increased consistently from 1970 to 2023, with a 46x rise from 2020 (95 papers) to 2023 (230 papers).
2. **2023 Peak**: The highest count (~230 papers) suggests a potential outlier or methodological shift in 2023.
3. **2024 Dip**: A 35% drop from 2023 to 2024 may indicate data collection anomalies, reduced output, or revised publication criteria.
### Interpretation
The data reflects a dramatic acceleration in academic publishing, likely driven by digitalization, open-access movements, and increased research output. The 2023 peak could correlate with global events (e.g., pandemic-related research) or changes in citation practices. The 2024 decline warrants further investigation to determine if it represents a genuine reduction in output or data inconsistencies. The trend underscores the growing scale of scholarly communication and its implications for academic institutions and policymakers.