## Horizontal Bar Chart: E-CARE: Avg. Concept Drift
### Overview
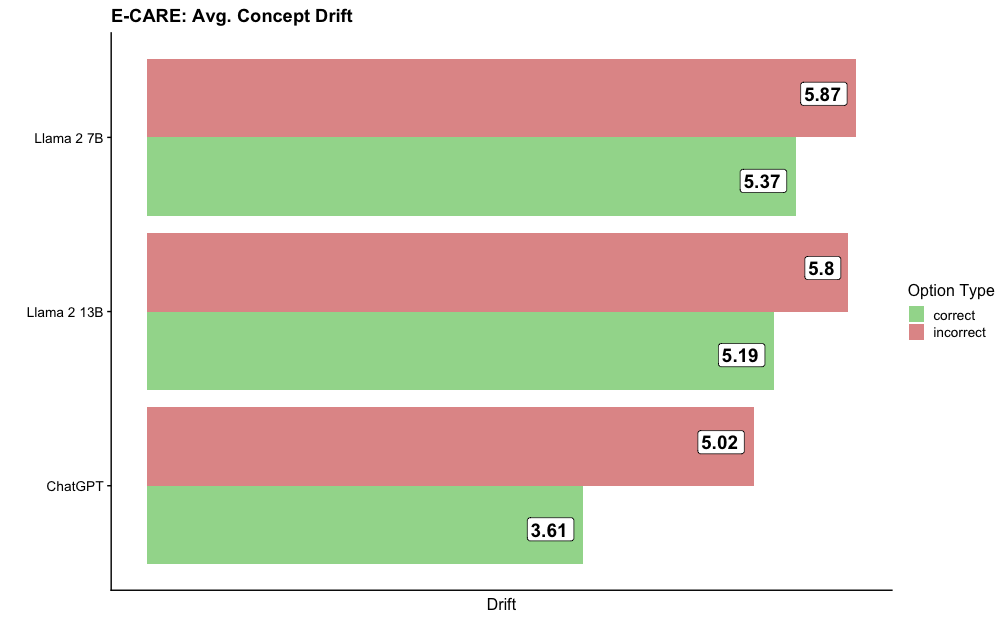
The image displays a horizontal bar chart titled "E-CARE: Avg. Concept Drift." It compares the average concept drift metric for three different large language models (LLMs) across two categories: "correct" and "incorrect" option types. The chart suggests that for all models, the average drift is higher when the model's output is incorrect compared to when it is correct.
### Components/Axes
* **Chart Title:** "E-CARE: Avg. Concept Drift" (located at the top-left).
* **Y-Axis (Vertical):** Lists the three models being compared. From top to bottom:
1. Llama 2 7B
2. Llama 2 13B
3. ChatGPT
* **X-Axis (Horizontal):** Labeled "Drift" at the bottom center. The axis represents a numerical scale for the drift metric, though specific tick marks are not shown. The values are provided as data labels on the bars.
* **Legend:** Positioned on the right side of the chart, titled "Option Type."
* A green square corresponds to the label "correct."
* A red (salmon) square corresponds to the label "incorrect."
* **Data Bars:** For each model, there are two horizontal bars:
* A green bar representing the "correct" option type.
* A red (salmon) bar representing the "incorrect" option type.
* Each bar has a numerical value displayed at its right end.
### Detailed Analysis
**Data Points and Trends:**
The chart presents the following specific values for average concept drift:
| Model | Incorrect Drift (Red Bar) | Correct Drift (Green Bar) | Trend |
| :--- | :--- | :--- | :--- |
| **Llama 2 7B** | 5.87 | 5.37 | The red bar is longer than the green bar, indicating higher drift for incorrect outputs. |
| **Llama 2 13B** | 5.8 | 5.19 | The red bar is longer than the green bar, indicating higher drift for incorrect outputs. |
| **ChatGPT** | 5.02 | 3.61 | The red bar is significantly longer than the green bar, indicating a much higher drift for incorrect outputs. |
**Visual Trend Verification:**
* For all three models, the "incorrect" (red) bar extends further to the right than its corresponding "correct" (green) bar. This visually confirms the trend that average concept drift is consistently higher for incorrect responses.
* The gap between the red and green bars appears largest for ChatGPT and smallest for Llama 2 7B.
### Key Observations
1. **Consistent Pattern:** Across all three models, the average concept drift metric is higher for incorrect option types than for correct ones.
2. **Model Comparison:**
* **Highest Drift (Incorrect):** Llama 2 7B has the highest recorded drift value at 5.87.
* **Lowest Drift (Correct):** ChatGPT has the lowest recorded drift value at 3.61.
* **Largest Discrepancy:** ChatGPT shows the greatest difference between its incorrect (5.02) and correct (3.61) drift scores, a difference of approximately 1.41.
* **Smallest Discrepancy:** Llama 2 7B shows the smallest difference between its incorrect (5.87) and correct (5.37) drift scores, a difference of 0.50.
3. **Model Size Trend (Llama 2):** Between the two Llama 2 models, the larger 13B model shows slightly lower drift values for both correct (5.19 vs. 5.37) and incorrect (5.8 vs. 5.87) categories compared to the smaller 7B model.
### Interpretation
The data suggests a strong correlation between a model's correctness on a task (as defined by the E-CARE benchmark) and its measured "concept drift." Concept drift, in this context, likely refers to a shift or instability in the model's internal representations or reasoning process.
* **Higher Drift for Errors:** The consistent finding that drift is higher for incorrect outputs implies that when a model makes a mistake, its internal processing may be less stable or more divergent from a consistent conceptual pathway. Correct answers appear to be associated with more stable internal states.
* **ChatGPT's Profile:** ChatGPT exhibits the most stable performance (lowest drift) when correct, but its drift increases substantially when incorrect. This could indicate that its correct reasoning is highly consistent, but its failure modes involve a more significant breakdown in conceptual stability.
* **Llama 2 Stability:** The Llama 2 models show higher baseline drift even when correct, and the increase when incorrect is less dramatic. This might suggest a different internal architecture or training paradigm that results in a different drift profile, potentially with more inherent variability in its representations.
* **Implication for Reliability:** If "concept drift" is a proxy for reasoning reliability, this chart indicates that monitoring drift could be a potential method for detecting when a model is likely to be incorrect. The clear separation between correct and incorrect drift values for each model supports this idea.
**Note on Language:** All text in the image is in English.