## Bar Chart: Pythia 6.9B Layer Analysis
### Overview
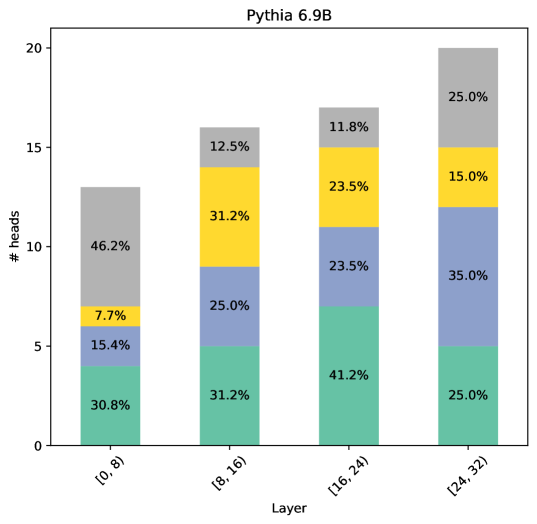
The image presents a bar chart visualizing the distribution of "# heads" across different layers of the Pythia 6.9B model. Each bar represents a layer range, and the bar is segmented into colored sections representing percentage contributions. The x-axis denotes the layer range, and the y-axis represents the number of heads.
### Components/Axes
* **Title:** Pythia 6.9B
* **X-axis Label:** Layer
* **Y-axis Label:** # heads
* **X-axis Markers:** \[0, 8], \[8, 16], \[16, 24], \[24, 32]
* **Legend:** (Implicitly defined by color)
* Lightest Green: 7.7% (in [0,8]) / 12.5% (in [8,16]) / 11.8% (in [16,24]) / 25.0% (in [24,32])
* Green: 30.8% (in [0,8]) / 31.2% (in [8,16]) / 41.2% (in [16,24]) / 25.0% (in [24,32])
* Teal: 15.4% (in [0,8]) / 25.0% (in [8,16]) / 23.5% (in [16,24]) / 35.0% (in [24,32])
* Orange: 46.2% (in [0,8]) / 31.2% (in [8,16]) / 23.5% (in [16,24]) / 15.0% (in [24,32])
### Detailed Analysis
The chart consists of four bars, each representing a layer range. The height of each bar indicates the total "# heads" for that layer range. Each bar is divided into four colored segments, representing the percentage contribution of each segment to the total height of the bar.
* **\[0, 8] Layer:** The bar reaches approximately 12 heads.
* Orange segment: 46.2% (approximately 5.5 heads)
* Teal segment: 15.4% (approximately 1.8 heads)
* Green segment: 30.8% (approximately 3.7 heads)
* Lightest Green segment: 7.7% (approximately 0.9 heads)
* **\[8, 16] Layer:** The bar reaches approximately 16 heads.
* Orange segment: 31.2% (approximately 5 heads)
* Teal segment: 25.0% (approximately 4 heads)
* Green segment: 31.2% (approximately 5 heads)
* Lightest Green segment: 12.5% (approximately 2 heads)
* **\[16, 24] Layer:** The bar reaches approximately 18 heads.
* Orange segment: 23.5% (approximately 4.2 heads)
* Teal segment: 23.5% (approximately 4.2 heads)
* Green segment: 41.2% (approximately 7.4 heads)
* Lightest Green segment: 11.8% (approximately 2.1 heads)
* **\[24, 32] Layer:** The bar reaches approximately 20 heads.
* Orange segment: 15.0% (approximately 3 heads)
* Teal segment: 35.0% (approximately 7 heads)
* Green segment: 25.0% (approximately 5 heads)
* Lightest Green segment: 25.0% (approximately 5 heads)
### Key Observations
* The number of heads generally increases as the layer range increases, from approximately 12 heads in \[0, 8] to approximately 20 heads in \[24, 32].
* The orange segment consistently represents a significant portion of each bar, particularly in the \[0, 8] layer.
* The teal segment increases in prominence in the \[24, 32] layer.
* The green segment is the largest in the \[16, 24] layer.
### Interpretation
This chart likely represents the distribution of attention heads across different layers of the Pythia 6.9B language model. The "# heads" likely refers to the number of attention heads in each layer. The percentage breakdown within each bar indicates how these heads are distributed across different attention mechanisms or functionalities (represented by the colors).
The increasing number of heads with deeper layers suggests that the model increases its capacity for parallel processing and attention as it processes information. The varying percentage contributions of each color across layers could indicate that different attention mechanisms become more or less important at different stages of the model's processing. The prominence of the orange segment in the earlier layers might suggest that a particular attention mechanism is crucial for initial feature extraction. The shift in the \[24, 32] layer, with a larger teal and lightest green segment, could indicate a change in the model's focus towards more complex relationships or higher-level abstractions. The chart provides insights into the internal workings of the Pythia 6.9B model and how it utilizes attention mechanisms across its layers.