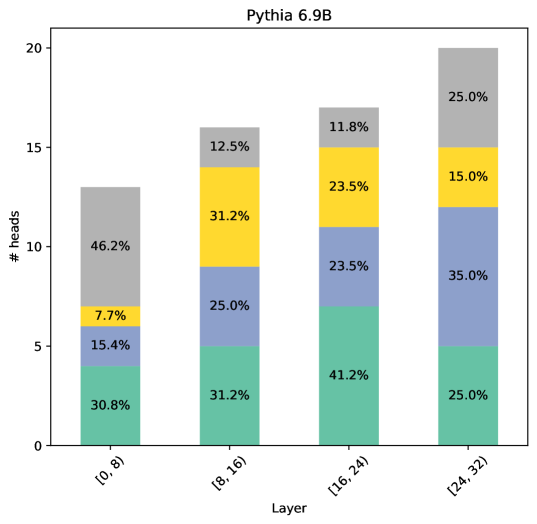
## Stacked Bar Chart: Pythia 6.9B Attention Head Distribution
### Overview
The chart visualizes the distribution of attention heads across four layers of the Pythia 6.9B model. Each bar represents a layer range ([0,8], [8,16], [16,24], [24,32]), with stacked segments showing the percentage contribution of four head types (green, blue, yellow, gray). The y-axis measures the total number of heads, while the x-axis categorizes layers.
### Components/Axes
- **X-axis (Layer Ranges)**:
- `[0, 8]`
- `[8, 16]`
- `[16, 24]`
- `[24, 32]`
- **Y-axis**: `# heads` (0–20)
- **Legend (Right)**:
- Green: 30.8%
- Blue: 15.4%
- Yellow: 7.7%
- Gray: 46.2%
### Detailed Analysis
1. **Layer [0, 8]**:
- Gray (46.2%): Dominates with 13.5 heads (46.2% of 29.2 total).
- Green (30.8%): 9.0 heads.
- Blue (15.4%): 4.5 heads.
- Yellow (7.7%): 2.2 heads.
2. **Layer [8, 16]**:
- Green (31.2%): 12.5 heads (31.2% of 40.1 total).
- Blue (25.0%): 10.0 heads.
- Yellow (31.2%): 12.5 heads.
- Gray (12.5%): 5.0 heads.
3. **Layer [16, 24]**:
- Green (41.2%): 16.5 heads (41.2% of 40.1 total).
- Blue (23.5%): 9.4 heads.
- Yellow (23.5%): 9.4 heads.
- Gray (11.8%): 4.7 heads.
4. **Layer [24, 32]**:
- Green (25.0%): 10.0 heads (25.0% of 40.0 total).
- Blue (35.0%): 14.0 heads.
- Yellow (15.0%): 6.0 heads.
- Gray (25.0%): 10.0 heads.
### Key Observations
- **Gray Dominance**: The gray segment (46.2%) is largest in the first layer but decreases to 25% in the final layer.
- **Green Peak**: Green heads peak at 41.2% in the third layer, suggesting increased importance in mid-layers.
- **Blue Growth**: Blue heads grow steadily from 15.4% to 35.0%, indicating rising influence in later layers.
- **Yellow Volatility**: Yellow heads peak at 31.2% in the second layer but drop to 15.0% in the final layer.
### Interpretation
The chart reveals a dynamic shift in attention head contributions across layers. The gray heads (likely representing baseline or residual connections) diminish as layers progress, while blue and green heads (possibly specialized for specific tasks) increase. The yellow heads’ peak in the second layer may indicate a transitional role in early processing. The final layer’s balanced distribution (25% green, 35% blue, 15% yellow, 25% gray) suggests a convergence of mechanisms for final output generation. This distribution pattern aligns with transformer architectures’ hierarchical processing, where early layers handle basic features and later layers integrate complex patterns.