## Diagram: Grid with Border
### Overview
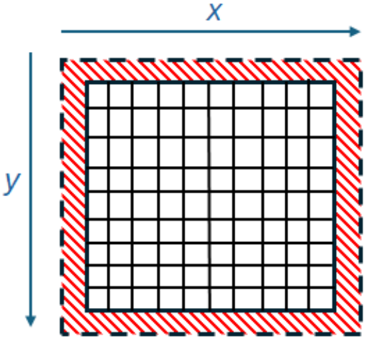
The image shows a square grid surrounded by a striped border. The grid is composed of smaller squares, and the border is made up of alternating red and white stripes, enclosed by a dashed black line. Arrows indicate the x and y axes.
### Components/Axes
* **Grid:** A square grid consisting of 10 rows and 10 columns of smaller squares. The grid lines are black.
* **Border:** A striped border surrounds the grid. The stripes alternate between red and white, and the border is enclosed by a dashed black line.
* **X-axis:** An arrow pointing to the right, labeled "x".
* **Y-axis:** An arrow pointing downwards, labeled "y".
### Detailed Analysis
* The grid is centered within the image.
* The border is of uniform width around the grid.
* The x-axis arrow is positioned above the grid, pointing to the right.
* The y-axis arrow is positioned to the left of the grid, pointing downwards.
### Key Observations
* The grid is a simple representation of a two-dimensional space.
* The border visually separates the grid from the surrounding area.
* The x and y axes indicate the orientation of the grid.
### Interpretation
The diagram likely represents a coordinate system or a spatial arrangement. The grid could represent a map, a data table, or any other two-dimensional structure. The x and y axes provide a frame of reference for locating points within the grid. The border serves to highlight the area of interest. The diagram is abstract and lacks specific data, but it provides a visual framework for representing spatial information.