# Technical Data Extraction: TCP Store Establishment Performance
## 1. Component Isolation
* **Header/Legend:** Located in the top-left quadrant of the chart area.
* **Main Chart Area:** A line graph with a light gray background and a dashed grid.
* **X-Axis (Horizontal):** Represents the independent variable "Number of devices".
* **Y-Axis (Vertical):** Represents the dependent variable "Time of TCP Store establishment".
## 2. Axis and Legend Information
* **Y-Axis Title:** Time of TCP Store establishment (Units not explicitly stated, likely milliseconds or seconds based on scale).
* **Y-Axis Markers:** 0, 100, 200, 300, 400, 500, 600, 700.
* **X-Axis Title:** Number of devices.
* **X-Axis Markers:** 0, 1,000, 2,000, 3,000, 4,000, 5,000, 6,000, 7,000, 8,000, 9,000, 10,000.
* **Legend [Top-Left]:**
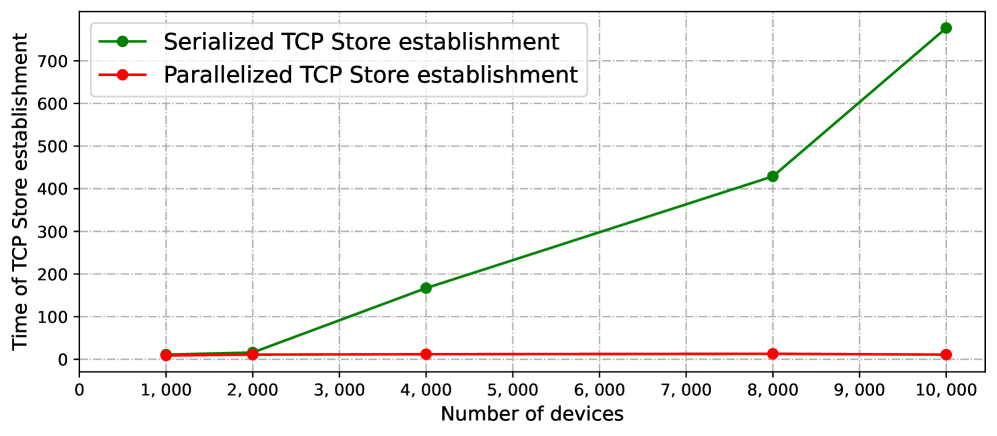
* **Green Line with Circle Markers:** Serialized TCP Store establishment.
* **Red Line with Circle Markers:** Parallelized TCP Store establishment.
## 3. Trend Verification and Data Extraction
### Series 1: Serialized TCP Store establishment (Green Line)
* **Visual Trend:** This line slopes upward significantly. The slope is relatively shallow between 1,000 and 2,000 devices, becomes steeper and linear between 2,000 and 8,000, and shows a further increase in steepness between 8,000 and 10,000 devices. This indicates that as the number of devices increases, the time required grows at an accelerating rate (super-linear).
* **Data Points (Approximate):**
* 1,000 devices: ~10
* 2,000 devices: ~20
* 4,000 devices: ~170
* 8,000 devices: ~430
* 10,000 devices: ~780
### Series 2: Parallelized TCP Store establishment (Red Line)
* **Visual Trend:** This line is nearly horizontal (flat). It shows almost no visible increase in time as the number of devices scales from 1,000 to 10,000. This indicates high efficiency and scalability, where the establishment time is independent of the device count within this range.
* **Data Points (Approximate):**
* 1,000 devices: ~10
* 2,000 devices: ~10
* 4,000 devices: ~10
* 8,000 devices: ~10
* 10,000 devices: ~10
## 4. Data Table Reconstruction
| Number of Devices | Serialized Time (Green) | Parallelized Time (Red) |
| :--- | :--- | :--- |
| 1,000 | ~10 | ~10 |
| 2,000 | ~20 | ~10 |
| 4,000 | ~170 | ~10 |
| 8,000 | ~430 | ~10 |
| 10,000 | ~780 | ~10 |
## 5. Summary of Findings
The chart demonstrates a critical performance difference between serialized and parallelized methods for TCP Store establishment. While both methods perform similarly at a low scale (1,000 devices), the **Serialized** method experiences a massive performance degradation as the network grows, reaching nearly 800 units of time at 10,000 devices. In contrast, the **Parallelized** method maintains a constant, low establishment time (approximately 10 units) regardless of the number of devices, showcasing superior scalability.