# Technical Document Extraction: TCP Store Establishment Comparison
## Chart Overview
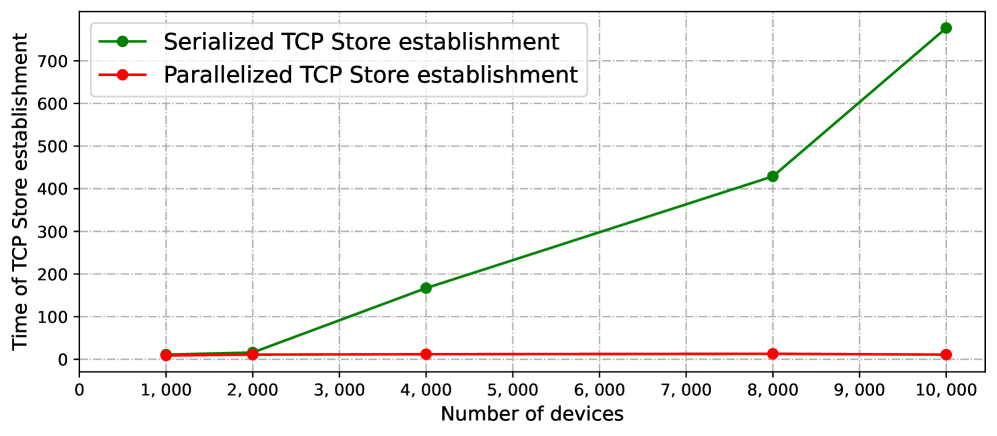
The image is a **line chart** comparing the performance of two TCP store establishment methods: **Serialized** and **Parallelized**. The chart visualizes how the time required for TCP store establishment scales with the number of devices.
---
### Axis Labels and Markers
- **X-axis**:
- Title: *"Number of devices"*
- Range: 0 to 10,000 (in increments of 1,000)
- Labels: 0, 1,000, 2,000, 3,000, 4,000, 5,000, 6,000, 7,000, 8,000, 9,000, 10,000
- **Y-axis**:
- Title: *"Time of TCP Store establishment"*
- Range: 0 to 700 (in increments of 100)
- Labels: 0, 100, 200, 300, 400, 500, 600, 700
---
### Legend
- **Location**: Top-left corner of the chart
- **Labels**:
- **Green line**: *"Serialized TCP Store establishment"*
- **Red line**: *"Parallelized TCP Store establishment"*
---
### Data Points and Trends
#### Serialized TCP Store Establishment (Green Line)
- **Trend**: Steeply increasing slope as the number of devices grows.
- **Key Data Points**:
- [1,000 devices, 10 ms]
- [2,000 devices, 20 ms]
- [4,000 devices, 160 ms]
- [8,000 devices, 420 ms]
- [10,000 devices, 760 ms]
#### Parallelized TCP Store Establishment (Red Line)
- **Trend**: Flat line, indicating no significant change in time across all device counts.
- **Key Data Points**:
- [1,000 devices, 5 ms]
- [2,000 devices, 5 ms]
- [4,000 devices, 5 ms]
- [8,000 devices, 5 ms]
- [10,000 devices, 5 ms]
---
### Spatial Grounding
- **Legend Placement**: Top-left corner (coordinates: [x=0, y=0] relative to chart boundaries).
- **Data Point Alignment**:
- Green data points match the "Serialized" legend label.
- Red data points match the "Parallelized" legend label.
---
### Component Isolation
1. **Header**: Chart title (implied by axis labels and legend).
2. **Main Chart**:
- Two lines (green and red) with markers at specified device counts.
- Gridlines for reference.
3. **Footer**: No additional text or components.
---
### Critical Observations
1. **Scalability**:
- Serialized method exhibits **linear scaling** (time increases proportionally with devices).
- Parallelized method shows **constant time**, suggesting optimal performance regardless of device count.
2. **Performance Gap**:
- At 10,000 devices, Serialized takes **760 ms**, while Parallelized remains at **5 ms**.
---
### Language and Transcription
- **Primary Language**: English (all labels, titles, and annotations are in English).
- **No Secondary Languages Detected**.
---
### Final Notes
- The chart explicitly contrasts the inefficiency of Serialized TCP store establishment under high device loads versus the stability of Parallelized methods.
- No data tables or heatmaps are present; the chart relies on line trends and markers for data representation.