## Chart: Confidence vs. Target Length
### Overview
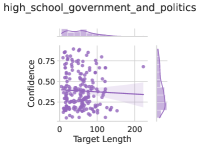
This image shows a scatter plot of "Confidence" versus "Target Length," with marginal density plots along the axes. The scatter plot displays individual data points, and a regression line with a confidence interval is overlaid. The marginal density plots show the distribution of each variable.
### Components/Axes
* **Title:** high\_school\_government\_and\_politics
* **X-axis:** Target Length
* Scale: 0 to 200, with tick marks at 0, 100, and 200.
* **Y-axis:** Confidence
* Scale: 0 to 0.75, with tick marks at 0, 0.25, 0.50, and 0.75.
* **Data Points:** Each point represents a data entry, colored in a light purple.
* **Regression Line:** A dark purple line represents the linear regression fit to the data.
* **Confidence Interval:** A shaded light purple region around the regression line represents the confidence interval.
* **Marginal Density Plots:** Density plots are shown along the x and y axes, indicating the distribution of "Target Length" and "Confidence" respectively.
### Detailed Analysis
* **Scatter Plot:** The scatter plot shows the relationship between "Target Length" and "Confidence." The data points are scattered, suggesting a weak correlation.
* **Regression Line:** The regression line is nearly flat, indicating a very weak negative correlation between "Target Length" and "Confidence."
* **Confidence Interval:** The confidence interval is relatively wide, suggesting a high degree of uncertainty in the regression line.
* **Marginal Density Plots:**
* The "Target Length" density plot shows a peak around 50, indicating that most data points have a "Target Length" around this value.
* The "Confidence" density plot shows a peak around 0.25, indicating that most data points have a "Confidence" around this value.
### Key Observations
* There is a weak negative correlation between "Target Length" and "Confidence."
* Most data points have a "Target Length" around 50 and a "Confidence" around 0.25.
* The confidence interval is relatively wide, suggesting a high degree of uncertainty in the regression line.
### Interpretation
The data suggests that there is a weak negative relationship between "Target Length" and "Confidence." This means that as "Target Length" increases, "Confidence" tends to decrease slightly. However, the relationship is weak, and there is a high degree of uncertainty. The marginal density plots show that most data points have a "Target Length" around 50 and a "Confidence" around 0.25. This suggests that the data is clustered around these values. The weak correlation and high uncertainty suggest that other factors may be influencing "Confidence" besides "Target Length."