## Scatter Plot with Marginal Distributions: High School Government and Politics
### Overview
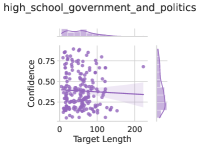
The image is a scatter plot with marginal distribution plots (histograms/density plots) on the top and right sides. It visualizes the relationship between "Target Length" and "Confidence" for a dataset labeled "high_school_government_and_politics". The plot uses a single data series represented by purple points.
### Components/Axes
* **Title:** `high_school_government_and_politics` (positioned at the top center).
* **X-Axis (Main Plot):** Labeled `Target Length`. The scale runs from 0 to 200, with major tick marks at 0, 100, and 200.
* **Y-Axis (Main Plot):** Labeled `Confidence`. The scale runs from 0.25 to 0.75, with major tick marks at 0.25, 0.50, and 0.75.
* **Data Series:** A single series of data points, all colored purple. There is no separate legend, as only one category is plotted.
* **Marginal Plots:**
* **Top Marginal Plot:** Aligned with the X-axis (`Target Length`). It shows the distribution of the Target Length variable. The shape is right-skewed, with the highest density between approximately 50 and 100.
* **Right Marginal Plot:** Aligned with the Y-axis (`Confidence`). It shows the distribution of the Confidence variable. The shape is left-skewed, with the highest density between approximately 0.25 and 0.50.
* **Reference Line:** A faint, horizontal grey line is present at `Confidence = 0.50`, spanning the width of the main plot.
### Detailed Analysis
* **Data Point Distribution:** The scatter plot shows a cloud of purple points. The density is highest in the lower-left quadrant, specifically for `Target Length` values between approximately 20-120 and `Confidence` values between 0.25-0.50.
* **Trend Verification:** There is a weak, negative visual trend. As `Target Length` increases, the cloud of points shows a slight tendency to drift downward on the `Confidence` axis. However, the relationship is very noisy with high variance.
* **Key Data Points & Ranges:**
* **Target Length:** Most data points fall between ~10 and ~180. The marginal plot confirms the mode is around 50-100.
* **Confidence:** Most data points fall between ~0.25 and ~0.65. The marginal plot confirms the mode is around 0.3-0.4.
* **Outliers:** A few points exist with high `Target Length` (>150) and moderate `Confidence` (~0.5). One notable point is near `(Target Length ≈ 200, Confidence ≈ 0.5)`.
* **Spatial Grounding:** The highest density of points is in the center-left region of the plot. The marginal plots are positioned directly above and to the right of the main chart area, sharing the same axis scales.
### Key Observations
1. **Inverse Relationship:** There is a general, though weak, inverse relationship between `Target Length` and `Confidence`. Longer targets are associated with slightly lower confidence scores on average.
2. **High Variability:** For any given `Target Length`, especially in the 50-150 range, there is a very wide spread of `Confidence` values (from ~0.25 to ~0.75). This indicates that `Target Length` alone is a poor predictor of `Confidence`.
3. **Distribution Skew:** Both variables are not normally distributed. `Target Length` is right-skewed (many short targets, few very long ones). `Confidence` is left-skewed (many low-confidence scores, fewer high-confidence scores).
4. **Central Tendency:** The horizontal line at `Confidence = 0.50` serves as a visual midpoint. The bulk of the data lies below this line, indicating that confidence scores for this dataset are generally on the lower side of the 0-1 scale (though the axis shown is truncated to 0.25-0.75).
### Interpretation
The data suggests that within the context of "high_school_government_and_politics" (which could refer to model predictions on educational content, essay grading, or similar tasks), the length of a target output (e.g., an answer, essay) has a modest negative correlation with the confidence of the system generating or evaluating it. The high variance implies that other, unmeasured factors are much stronger determinants of confidence than length alone.
The skewed distributions are significant. The right skew in `Target Length` indicates the task or dataset predominantly involves shorter responses. The left skew in `Confidence` is more critical; it suggests the system is frequently uncertain about its outputs for this domain. This could point to the inherent complexity of the subject matter, limitations in the model's training data for government and politics, or ambiguity in the evaluation criteria.
The outlier at the far right (`Target Length ≈ 200`) with moderate confidence is interesting. It represents a rare, very long response that the system was reasonably confident about, potentially indicating a well-structured, comprehensive answer that the model recognized as correct.
**In summary, the plot reveals a domain where outputs are typically short and met with low-to-moderate confidence, with length being a minor, negative factor. The primary insight is the need to investigate the causes of low confidence, as length is not a sufficient explanation.**