## Scatter Plot: high_school_government_and_politics
### Overview
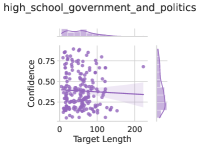
The image is a scatter plot visualizing the relationship between "Target Length" (x-axis) and "Confidence" (y-axis). A trend line with a shaded confidence interval is overlaid on the data points. Histograms for both axes are displayed in the margins.
### Components/Axes
- **Title**: "high_school_government_and_politics" (top-left)
- **X-axis**: "Target Length" (0–200, labeled in increments of 100)
- **Y-axis**: "Confidence" (0.25–0.75, labeled in increments of 0.25)
- **Legend**: Located in the top-left corner (no explicit labels visible; assumed to correspond to data points).
- **Trend Line**: Dark purple line with a shaded confidence interval (light purple gradient).
- **Histograms**:
- Top histogram: Distribution of "Target Length" (x-axis).
- Right histogram: Distribution of "Confidence" (y-axis).
### Detailed Analysis
- **Data Points**:
- Purple dots scattered across the plot.
- Most points cluster between **Target Length 50–150** and **Confidence 0.3–0.7**.
- Outliers: A few points near **Target Length 0–20** and **Confidence 0.75**.
- **Trend Line**:
- Slightly downward slope from ~0.65 (at x=0) to ~0.45 (at x=200).
- Shaded confidence interval spans ~0.45–0.65 (95% interval?).
- **Histograms**:
- **Target Length**: Peaks between 50–100, tapering off at extremes.
- **Confidence**: Peaks near 0.5, with a long tail toward lower values.
### Key Observations
1. **Negative Correlation**: Confidence decreases as Target Length increases (approximate slope: -0.001 per unit length).
2. **Confidence Interval**: The shaded area suggests uncertainty in the trend line, with variability increasing at higher Target Lengths.
3. **Distribution Skew**:
- Target Lengths are skewed left (more data in 50–100 range).
- Confidence values are bimodal, with clusters near 0.4–0.6 and 0.7–0.75.
### Interpretation
The data suggests an inverse relationship between Target Length and Confidence in the context of high school government and politics. Longer targets (e.g., complex policy proposals) may correlate with lower confidence, possibly due to increased complexity or ambiguity. The shaded confidence interval indicates that this trend is not perfectly linear, with variability widening at higher Target Lengths. The histograms reveal that most data points fall within moderate ranges for both variables, but outliers at low Target Lengths and high Confidence (e.g., 0.75) warrant further investigation. This could reflect specific cases where short targets (e.g., simple questions) yield high confidence, or measurement biases in the data collection process.