## Data Flow Diagram: Data Processing Stages
### Overview
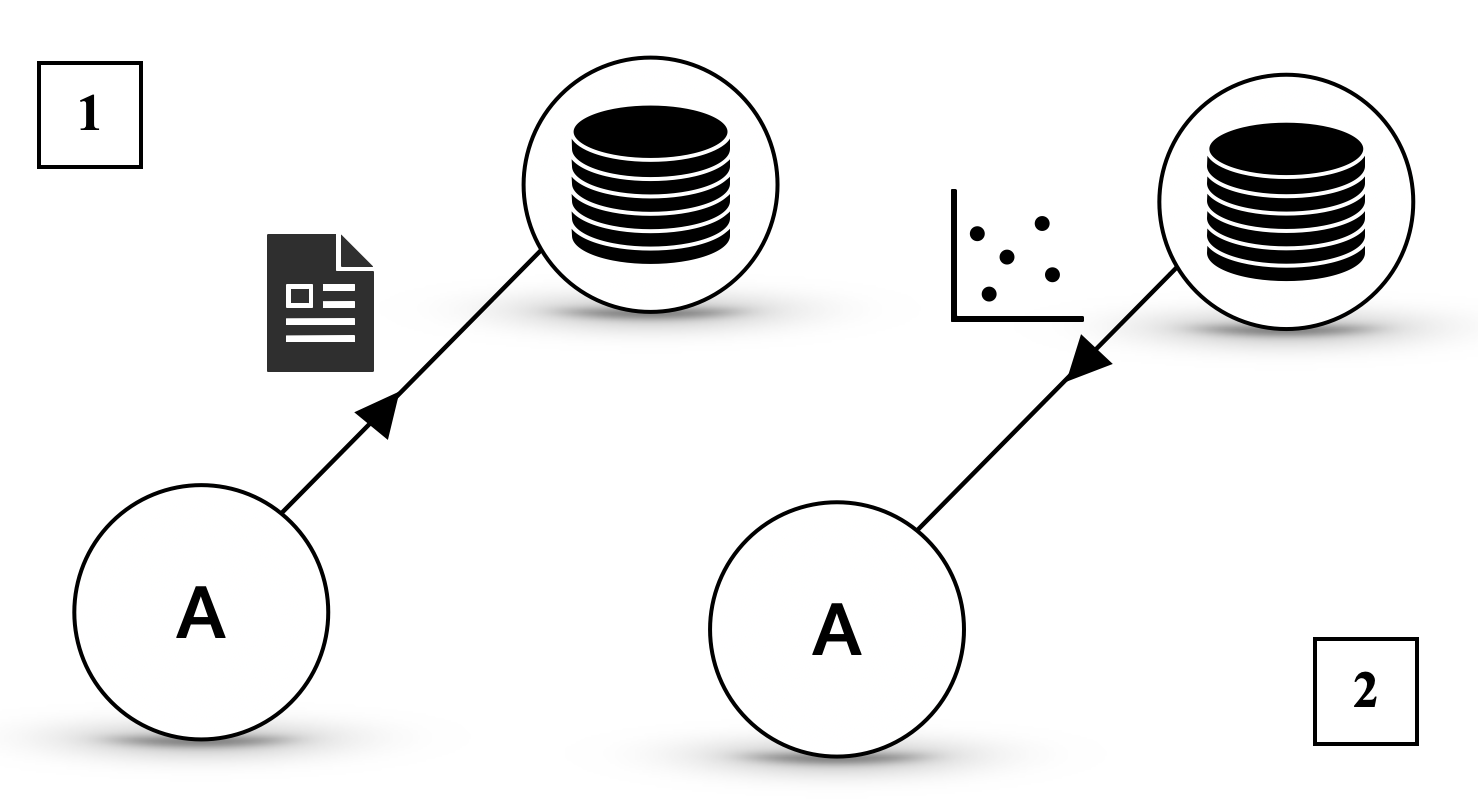
The image is a data flow diagram illustrating two sequential data processing stages. Each stage involves an input, a processing step labeled "A", and an output to a data store. The diagram highlights the transformation of data from a document to a dataset, and then to another dataset after some analysis.
### Components/Axes
* **Nodes:** Two circular nodes, each labeled "A", representing processing steps.
* **Data Stores:** Two circular nodes containing a stack of disks, representing data storage.
* **Input:** A document icon on the left side of the diagram.
* **Output:** A scatter plot icon on the right side of the diagram.
* **Flow Arrows:** Arrows indicating the direction of data flow.
* **Labels:** Numbered squares labeled "1" (top-left) and "2" (bottom-right), possibly indicating stages or versions.
### Detailed Analysis or ### Content Details
**Stage 1:**
* **Input:** A document icon flows into processing node "A".
* **Processing:** Node "A" transforms the document data.
* **Output:** The output of node "A" flows into a data store represented by a stack of disks.
**Stage 2:**
* **Input:** The data store (stack of disks) is the input for a scatter plot.
* **Processing:** Node "A" processes the data.
* **Output:** The output of node "A" flows into another data store represented by a stack of disks.
**Icons:**
* **Document Icon:** Represents a document file, possibly containing raw data.
* **Data Store Icon:** Represents a database or data storage system.
* **Scatter Plot Icon:** Represents a dataset visualized as a scatter plot.
**Labels:**
* **"A"**: Label inside each processing node.
* **"1"**: Label in the top-left corner.
* **"2"**: Label in the bottom-right corner.
### Key Observations
* The diagram illustrates a two-stage data processing pipeline.
* The data is transformed from a document to a dataset, and then to another dataset after some analysis.
* The processing steps are represented by nodes labeled "A".
* The data stores are represented by stacks of disks.
### Interpretation
The diagram depicts a typical data processing workflow. In the first stage, raw data from a document is processed and stored in a database. In the second stage, the data is analyzed (possibly visualized as a scatter plot) and stored in another database. The labels "1" and "2" might indicate different versions or stages of the data processing pipeline. The processing step "A" could represent various data transformation or analysis operations. The diagram suggests a sequential flow of data from raw input to processed and analyzed output.