## Diagram: Data Processing Flow
### Overview
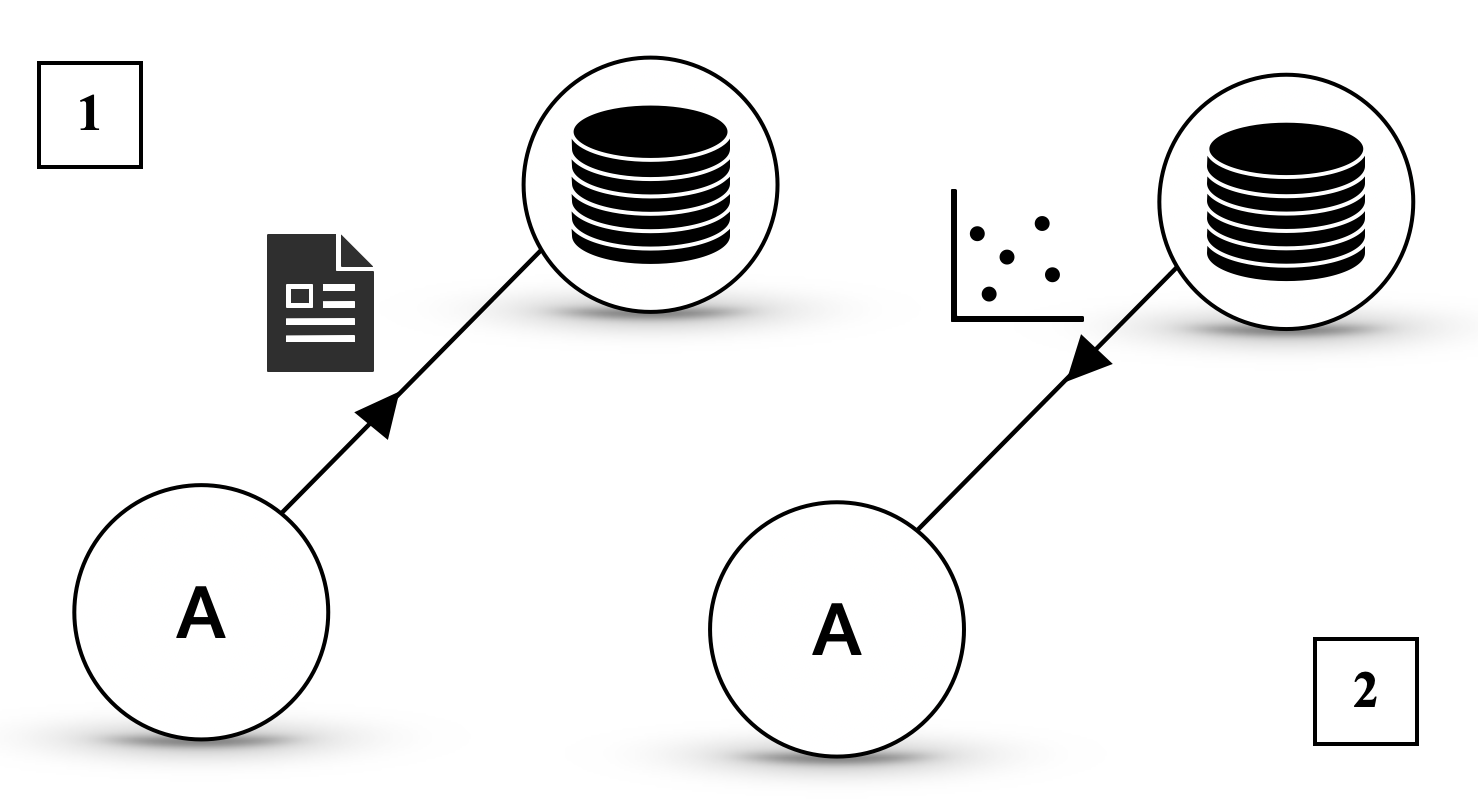
This diagram illustrates two distinct data processing pathways, both originating from a conceptual entity labeled "A". Pathway 1 shows "A" interacting with a document icon, leading to a stack of discs icon. Pathway 2 shows "A" interacting with a scatter plot, which then leads to a stack of discs icon. The diagram is segmented into two main sections, marked by the numbers "1" and "2" in square boxes.
### Components/Axes
* **Circles with "A"**: Two instances of a circular node, each containing the letter "A". These likely represent a source or a process.
* **Document Icon**: A stylized icon depicting a document with lines of text and a folded corner. This represents a document or data file.
* **Scatter Plot**: A simple 2D scatter plot with an L-shaped axis, showing several data points. This represents raw or analyzed data.
* **Stack of Discs Icon**: A stylized icon depicting a stack of horizontal discs. This commonly represents a database or a collection of data.
* **Arrows**: Directed lines indicating the flow of information or process.
* **Numbered Boxes (1 and 2)**: Square boxes containing the numbers "1" and "2", likely segmenting or labeling the two distinct pathways.
### Detailed Analysis or Content Details
**Pathway 1 (Segment 1):**
* A circular node labeled "A" is connected by an arrow to a document icon.
* The document icon is then connected by an arrow to a stack of discs icon.
* This pathway suggests that "A" interacts with a document, and the output or result of this interaction is stored or represented by the stack of discs.
**Pathway 2 (Segment 2):**
* A circular node labeled "A" is connected by an arrow to a scatter plot.
* The scatter plot is then connected by an arrow to a stack of discs icon.
* This pathway suggests that "A" interacts with or generates a scatter plot (representing data points), and this data is then stored or represented by the stack of discs.
### Key Observations
* Both pathways converge on the "stack of discs" icon, implying that both processes ultimately result in data being stored or managed in a database-like structure.
* Pathway 1 involves a document as an intermediate step, while Pathway 2 involves a scatter plot. This suggests different types of input or intermediate data representations.
* The repetition of the "A" node suggests that "A" is a common starting point or a recurring process in both scenarios.
### Interpretation
This diagram visually represents two distinct data processing workflows.
**Pathway 1** suggests a process where an entity "A" consumes or processes a document, leading to the creation or storage of structured data (represented by the stack of discs). This could symbolize tasks like data extraction from documents, document analysis, or content management.
**Pathway 2** suggests a process where an entity "A" interacts with or generates a set of data points visualized as a scatter plot. This data is then stored in a database. This pathway might represent data analysis, visualization of raw data, or the output of a statistical model.
The common endpoint of both pathways, the "stack of discs," indicates that regardless of the initial input (document or scatter plot data), the ultimate outcome is data consolidation or storage in a persistent data repository. The diagram highlights that different types of data inputs or intermediate representations can lead to the same data storage outcome. The numbers "1" and "2" serve to clearly delineate these two separate, albeit related, processes. The diagram is abstract and does not provide specific details about the nature of "A," the content of the document, or the specific data points in the scatter plot, but it effectively communicates a conceptual flow of data processing and storage.