\n
## Diagram: Data Flow Illustration
### Overview
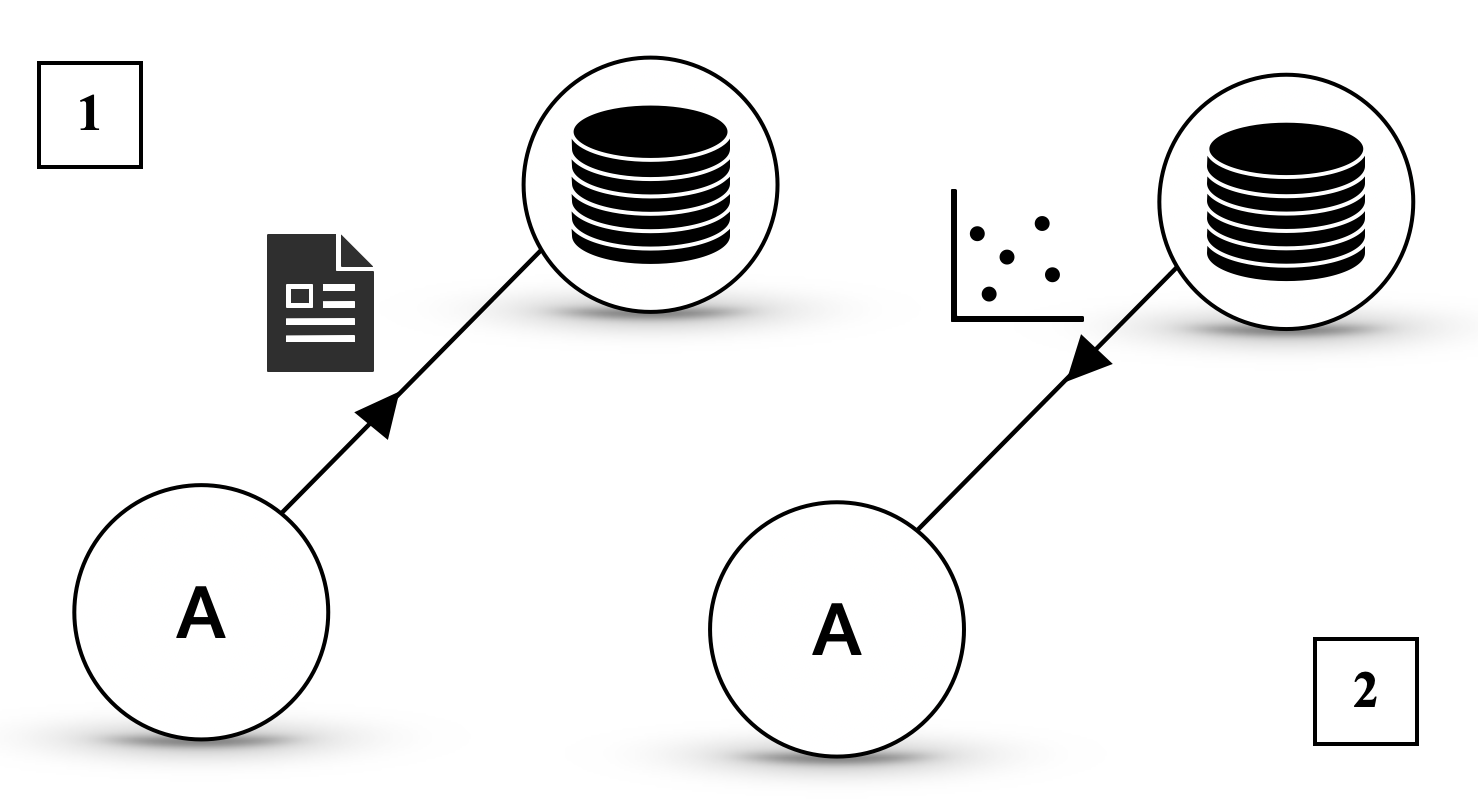
The image depicts a simplified data flow diagram. It shows two instances labeled "A" interacting with different data sources and a document. The diagram illustrates a process where "A" can access or generate a document, and also interact with data storage (represented by cylinder icons) and a data visualization (represented by a scatter plot).
### Components/Axes
The diagram consists of the following components:
* **Node A (x2):** Two circular nodes labeled "A". These likely represent processes, systems, or actors.
* **Document Icon:** A rectangular icon representing a document, with lines suggesting pages within.
* **Data Storage (x2):** Two cylinder icons, representing data storage or databases.
* **Scatter Plot:** A rectangular area containing a scatter plot of data points.
* **Arrows:** Lines with arrowheads indicating the direction of data flow.
* **Numbered Boxes (x2):** Boxes labeled "1" and "2" in the top-left and bottom-right corners, respectively. Their purpose is unclear without further context.
### Detailed Analysis or Content Details
The diagram shows the following data flows:
1. **A to Document:** An arrow originates from the left "A" node and points towards the document icon. This suggests that "A" can create or access the document.
2. **A to Data Storage (Left):** An arrow originates from the left "A" node and points towards the left data storage cylinder. This suggests "A" can read from or write to this data storage.
3. **A to Scatter Plot & Data Storage (Right):** An arrow originates from the right "A" node and splits into two directions. One branch points to the scatter plot, and the other points to the right data storage cylinder. This suggests "A" can generate or use the scatter plot and also interact with the right data storage.
4. **Scatter Plot to Data Storage (Right):** An arrow originates from the scatter plot and points to the right data storage cylinder. This suggests the scatter plot data is stored in the right data storage.
There are no numerical values or specific data labels present in the diagram. The scatter plot contains approximately 10-15 data points, but their exact coordinates or values are not discernible.
### Key Observations
* The diagram highlights a dual pathway for the "A" node. The left "A" interacts with a document and one data storage, while the right "A" interacts with a scatter plot and another data storage.
* The scatter plot appears to be an intermediate step, potentially used for analysis or visualization before being stored in the right data storage.
* The numbered boxes "1" and "2" do not appear to be directly related to the data flow and their purpose is unknown.
### Interpretation
The diagram likely represents a data processing pipeline. "A" could be a user, a system, or a process that interacts with data in various forms. The left "A" handles document-based data, while the right "A" handles more analytical data represented by the scatter plot. The data storage cylinders represent persistent storage for both types of data. The diagram suggests a workflow where data can be generated, processed, visualized, and stored.
The presence of two "A" nodes suggests a potential separation of concerns or parallel processing. The numbered boxes could indicate steps in a larger process or simply be identifiers for different parts of the diagram. Without additional context, it's difficult to determine the precise meaning of the diagram. It is a high-level illustration of data flow, lacking specific details about the data itself or the operations performed on it.