## Diagram: Data Processing Flow with Two Input Methods
### Overview
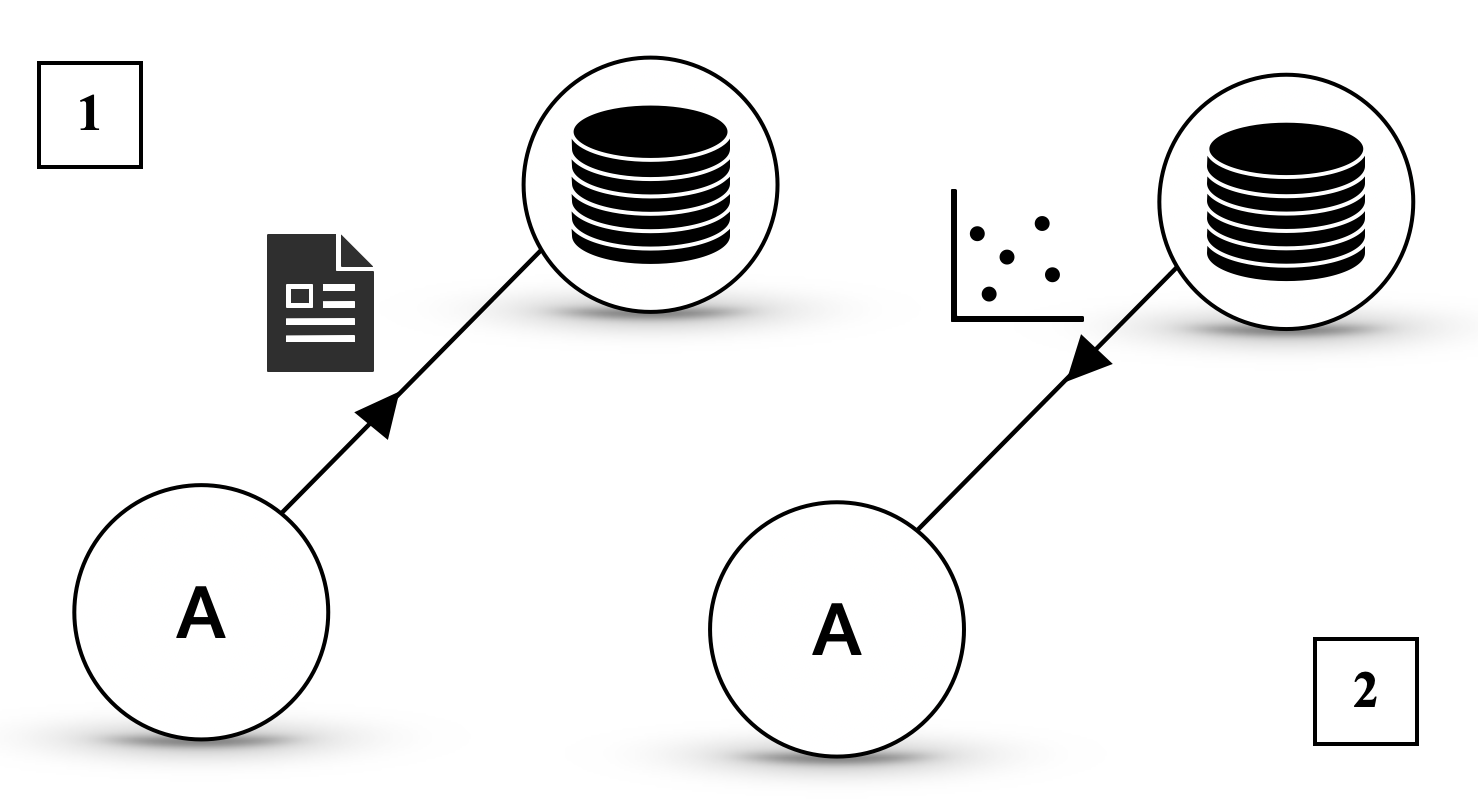
The image depicts a two-part technical diagram illustrating data flow from a source labeled "A" to a stack of disks. Two distinct input methods are shown:
1. **Section 1**: A document icon (representing structured data) transfers information to the disks via an arrow.
2. **Section 2**: A scatter plot (representing unstructured or variable data) transfers information to the disks via an arrow.
### Components/Axes
- **Labels**:
- Two circles labeled "A" (source of data).
- Two stacks of disks (destination for processed data).
- Section labels "1" (top-left) and "2" (bottom-right).
- **Icons**:
- Document icon (Section 1): Represents structured data (e.g., text, files).
- Scatter plot icon (Section 2): Represents unstructured or variable data (e.g., measurements, observations).
- **Arrows**:
- Black arrows indicate directional flow from "A" to the disks.
### Detailed Analysis
- **Section 1**:
- A document icon (black with white text lines) points to a stack of disks.
- No numerical values or axis markers present.
- **Section 2**:
- A scatter plot icon (black with five white dots) points to a stack of disks.
- No numerical values or axis markers present.
### Key Observations
1. Both sections share identical disk stacks, suggesting a common destination for processed data.
2. The document icon (Section 1) implies structured data input, while the scatter plot (Section 2) implies unstructured or variable data input.
3. No quantitative data (e.g., values, scales) is provided in the diagram.
### Interpretation
The diagram likely represents two methods of data ingestion or processing:
- **Structured Data (Section 1)**: Direct transfer of organized information (e.g., documents, files) to storage (disks).
- **Unstructured Data (Section 2)**: Transfer of variable or observational data (e.g., measurements, sensor readings) to storage.
- The identical disk stacks in both sections suggest that both data types are ultimately stored or processed in the same system, though their input methods differ.
No numerical trends, outliers, or anomalies can be identified due to the absence of quantitative data. The diagram emphasizes the relationship between data sources (A) and storage (disks) via distinct input mechanisms.