## Heatmap: Accuracy
### Overview
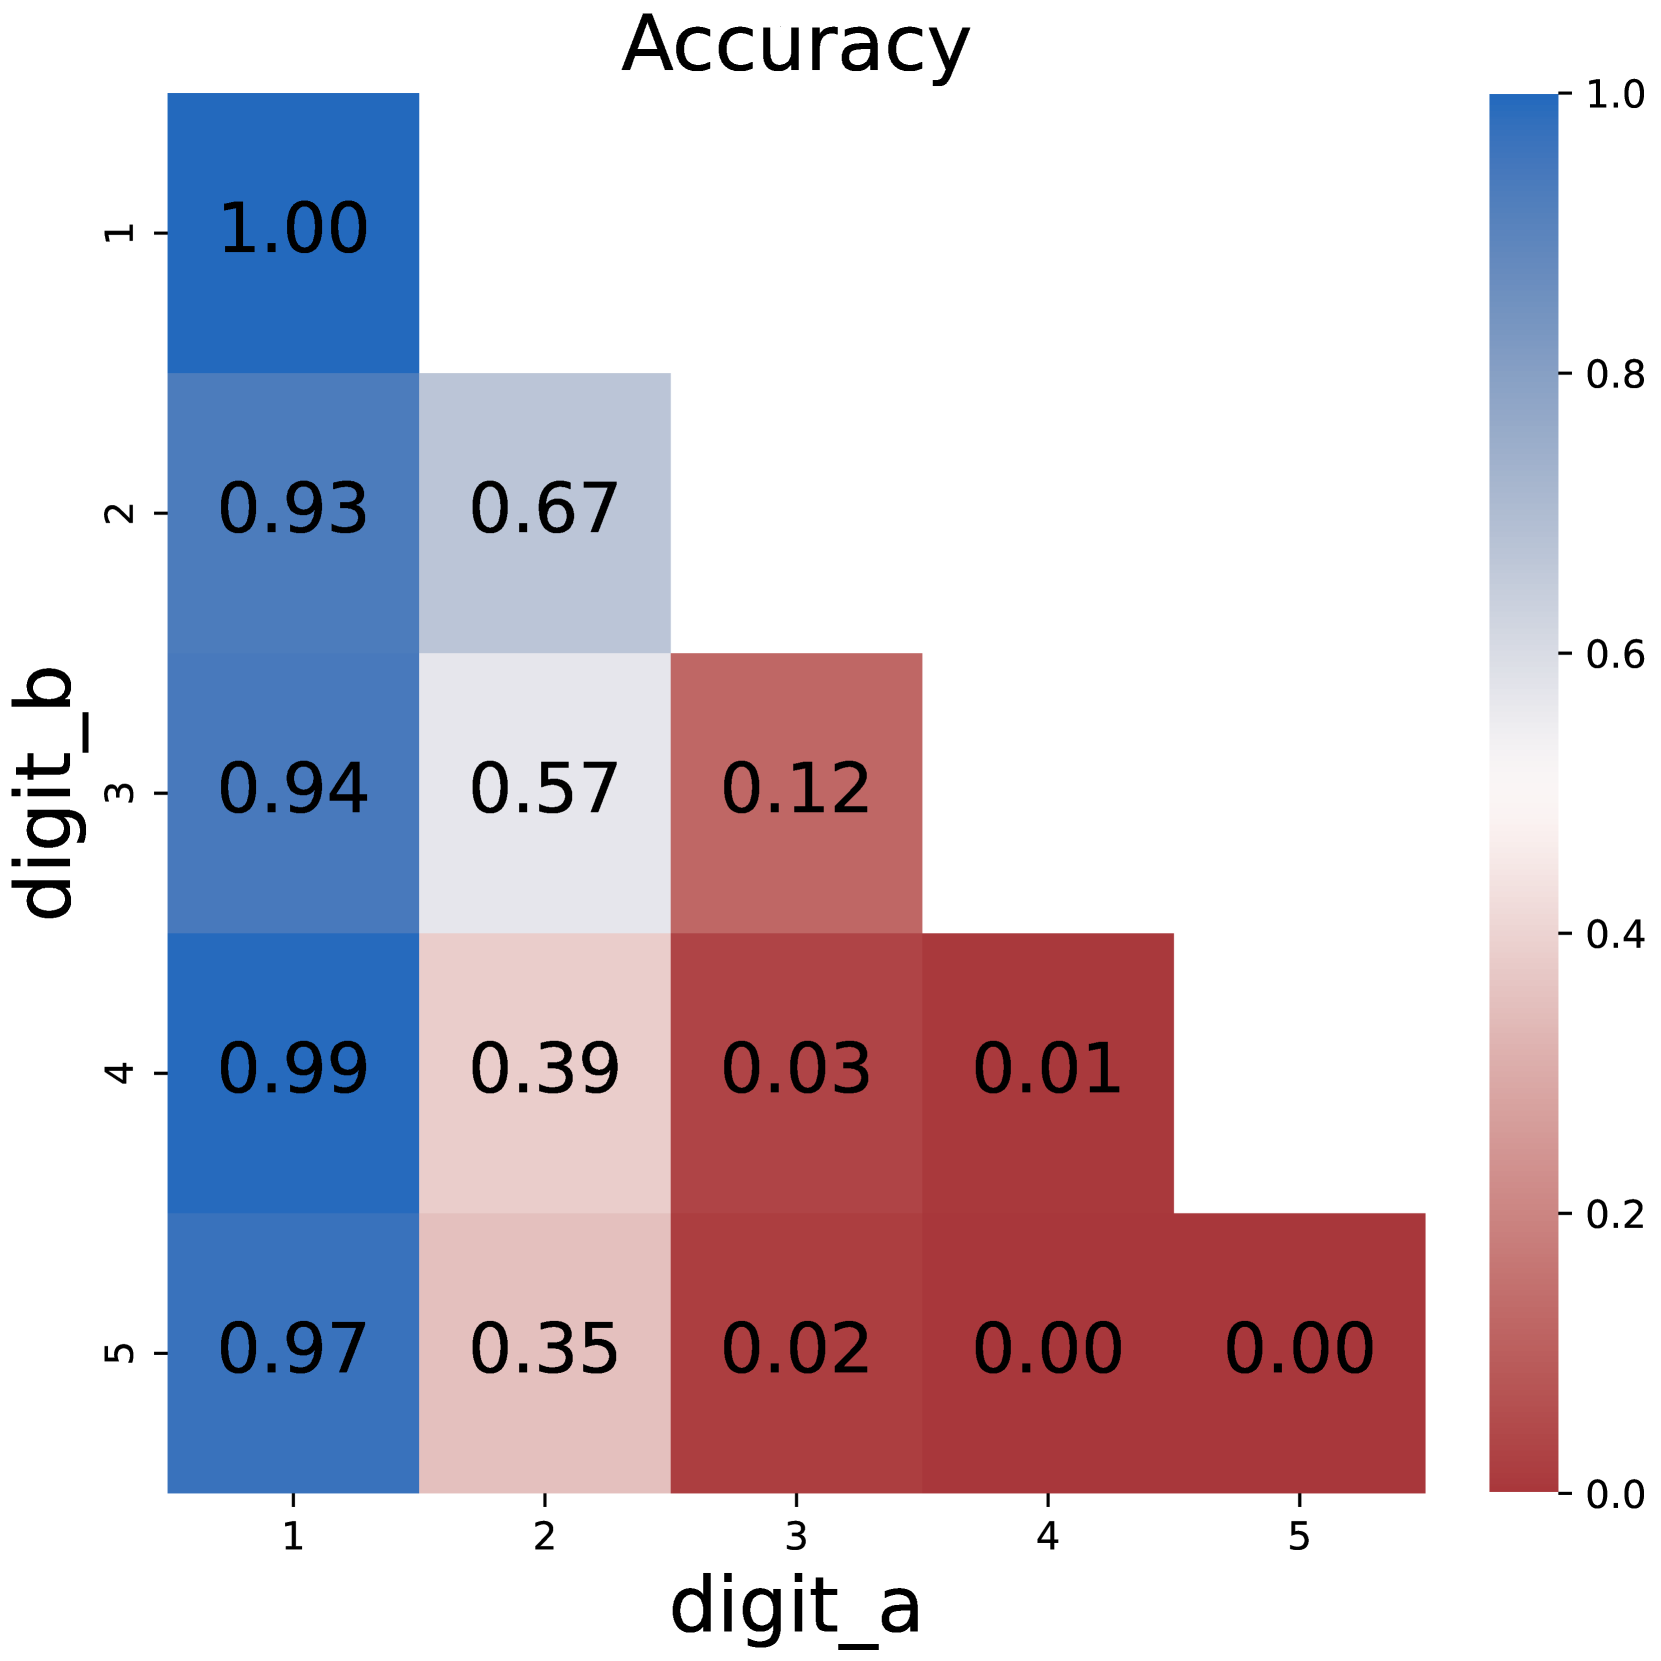
The image is a heatmap displaying accuracy values. The x-axis represents 'digit_a' and the y-axis represents 'digit_b', both ranging from 1 to 5. The color intensity of each cell corresponds to the accuracy value, with blue indicating high accuracy and red indicating low accuracy. The heatmap is triangular, with values only present for digit_a >= digit_b.
### Components/Axes
* **Title:** Accuracy
* **X-axis:** digit\_a, with ticks at 1, 2, 3, 4, and 5.
* **Y-axis:** digit\_b, with ticks at 1, 2, 3, 4, and 5.
* **Colorbar:** Ranges from 0.0 to 1.0, with blue representing 1.0 and red representing 0.0. Intermediate values are represented by a gradient from blue to white to red. Ticks are at 0.0, 0.2, 0.4, 0.6, 0.8, and 1.0.
### Detailed Analysis or ### Content Details
Here's a breakdown of the accuracy values for each combination of digit_a and digit_b:
* **digit\_b = 1:**
* digit\_a = 1: 1.00 (Blue)
* **digit\_b = 2:**
* digit\_a = 1: 0.93 (Blue)
* digit\_a = 2: 0.67 (Light Blue/White)
* **digit\_b = 3:**
* digit\_a = 1: 0.94 (Blue)
* digit\_a = 2: 0.57 (Light Blue/White)
* digit\_a = 3: 0.12 (Red)
* **digit\_b = 4:**
* digit\_a = 1: 0.99 (Blue)
* digit\_a = 2: 0.39 (Light Red/White)
* digit\_a = 3: 0.03 (Red)
* digit\_a = 4: 0.01 (Red)
* **digit\_b = 5:**
* digit\_a = 1: 0.97 (Blue)
* digit\_a = 2: 0.35 (Light Red/White)
* digit\_a = 3: 0.02 (Red)
* digit\_a = 4: 0.00 (Red)
* digit\_a = 5: 0.00 (Red)
### Key Observations
* The accuracy is highest when digit\_a and digit\_b are equal to 1.
* The accuracy decreases as the difference between digit\_a and digit\_b increases.
* When digit\_a and digit\_b are equal, the accuracy decreases as both digits increase.
### Interpretation
The heatmap suggests that the model performs best when classifying the digit '1'. The accuracy drops significantly when trying to classify higher digits, especially when digit\_a is much larger than digit\_b. This could indicate that the model struggles to distinguish between higher digits or that there is a bias towards classifying digits as '1'. The triangular shape of the heatmap implies that the model is only evaluated when digit\_a is greater than or equal to digit\_b, which might be due to the nature of the classification task or the data used for evaluation.