## Heatmap: Accuracy Matrix
### Overview
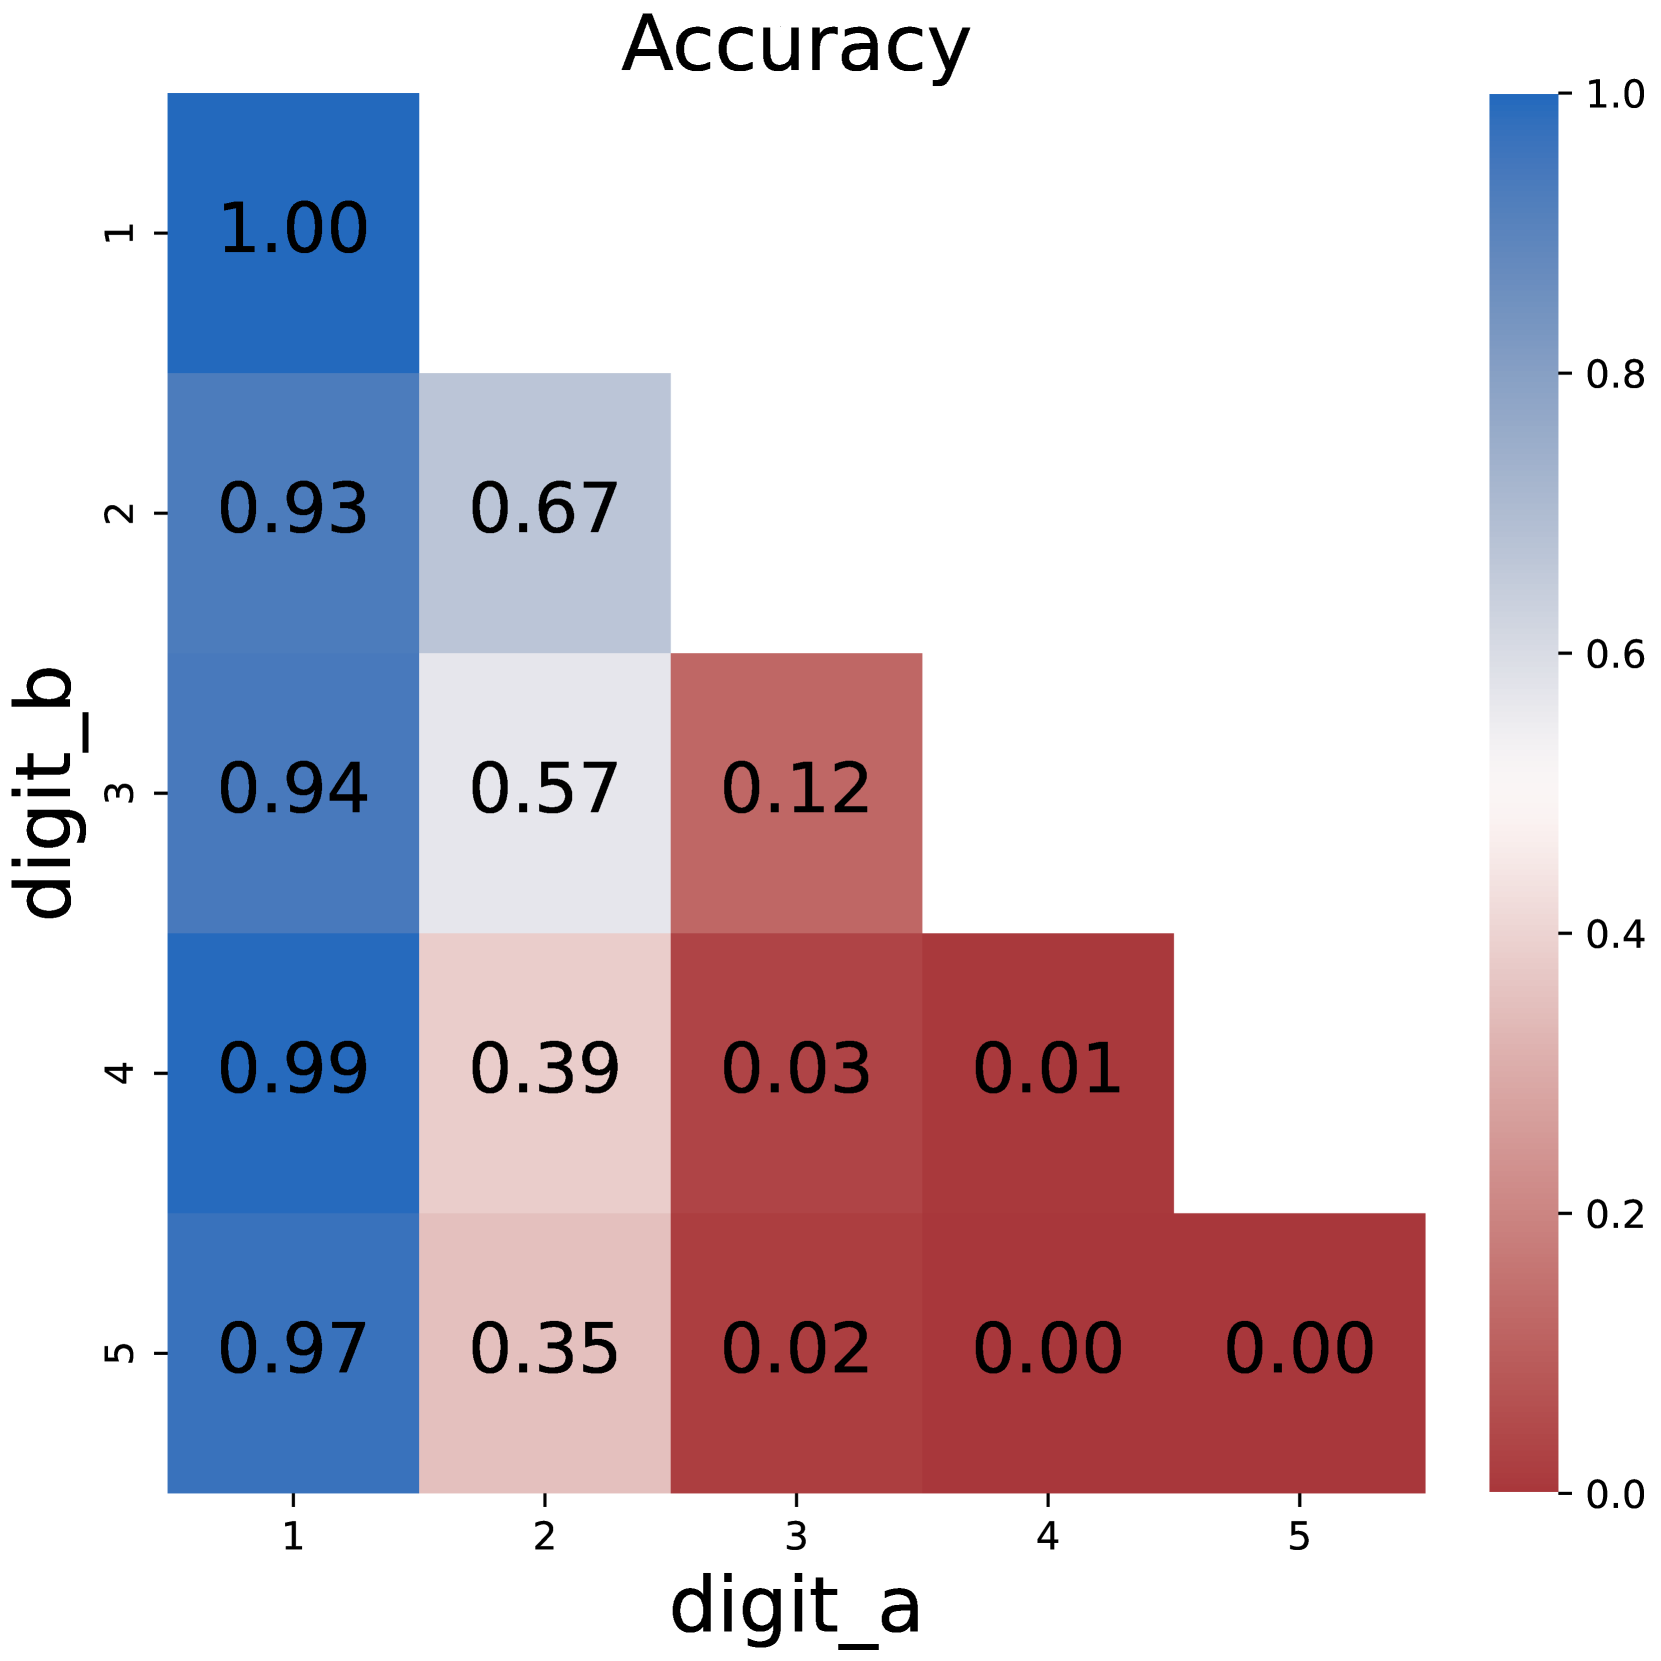
The image displays a 5x5 heatmap titled "Accuracy," visualizing the relationship between two digit classifications: `digit_a` (horizontal axis) and `digit_b` (vertical axis). Values range from 0.00 (red) to 1.00 (blue), with intermediate shades of gray and pink. The heatmap reveals a strong diagonal pattern of high accuracy, with diminishing performance as digit values diverge.
### Components/Axes
- **X-axis (digit_a)**: Labeled 1 to 5, representing predicted digit values.
- **Y-axis (digit_b)**: Labeled 1 to 5, representing true digit values.
- **Legend**: Positioned on the right, mapping colors to accuracy values:
- Blue (1.00): Perfect accuracy
- Gray (0.67–0.57): Moderate accuracy
- Pink (0.39–0.35): Low accuracy
- Red (0.00–0.03): No accuracy
- **Title**: "Accuracy" (centered at the top).
### Detailed Analysis
- **Diagonal Dominance**:
- `digit_a = digit_b` (e.g., 1→1, 2→2) shows near-perfect accuracy (1.00, 0.97, 0.94, 0.99, 0.97).
- Example: `digit_b=1` predicting `digit_a=1` achieves 1.00 accuracy.
- **Off-Diagonal Trends**:
- Accuracy decreases as digit values diverge. For instance:
- `digit_b=2` predicting `digit_a=3` = 0.12 (red).
- `digit_b=4` predicting `digit_a=5` = 0.01 (dark red).
- **Anomalies**:
- `digit_b=5` predicting `digit_a=5` = 0.00 (contradicts diagonal trend; likely an error or edge case).
### Key Observations
1. **Highest Accuracy**: Diagonal cells (same digit) dominate, with values ≥0.93.
2. **Lowest Accuracy**: Bottom-right corner (`digit_b=5`→`digit_a=5`) shows 0.00, an outlier.
3. **Gradual Decline**: Accuracy diminishes symmetrically from the diagonal (e.g., `digit_b=3`→`digit_a=4` = 0.03).
### Interpretation
The heatmap demonstrates a model optimized for digit classification, excelling at matching identical digits but struggling with dissimilar ones. The 0.00 value for `digit_b=5`→`digit_a=5` is puzzling and may indicate:
- A data entry error (e.g., mislabeled true digit).
- A failure mode for the digit "5" in the dataset.
- A limitation in the model's ability to generalize even for identical inputs.
The diagonal dominance suggests the model relies heavily on exact digit matching, with minimal capacity to infer relationships between similar digits (e.g., 2 vs. 3). This could reflect a shallow feature representation or overfitting to training examples.