## Bar Chart: Distribution of Factual Associations and Hallucinations Across Categories
### Overview
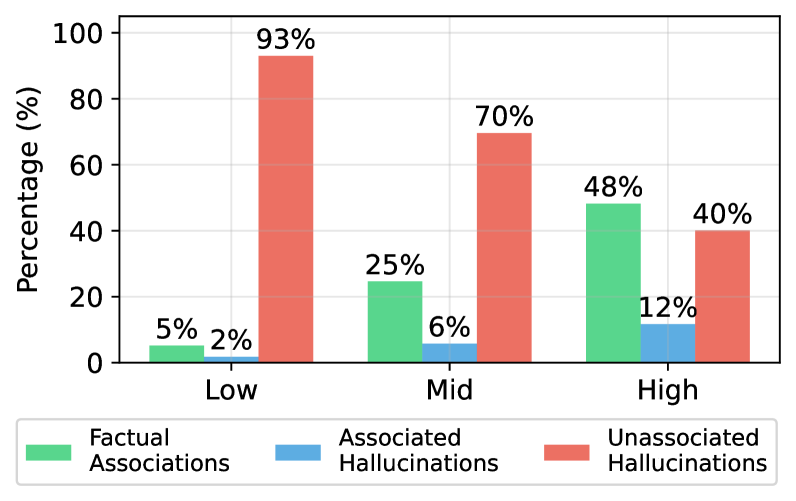
The image is a grouped bar chart comparing three metrics—**Factual Associations**, **Associated Hallucinations**, and **Unassociated Hallucinations**—across three categories: **Low**, **Mid**, and **High**. The y-axis represents percentages (0–100%), and the x-axis lists the categories. Each group contains three bars, color-coded per legend.
### Components/Axes
- **X-axis (Categories)**: Labeled "Low", "Mid", "High" (left to right).
- **Y-axis (Percentage)**: Ranges from 0% to 100% in 20% increments.
- **Legend**: Located at the bottom, with:
- **Green**: Factual Associations
- **Blue**: Associated Hallucinations
- **Red**: Unassociated Hallucinations
- **Bar Groups**: Each category (Low, Mid, High) has three adjacent bars (green, blue, red).
### Detailed Analysis
#### Low Category
- **Factual Associations**: 5% (green bar, shortest in group).
- **Associated Hallucinations**: 2% (blue bar, shortest overall).
- **Unassociated Hallucinations**: 93% (red bar, tallest overall).
#### Mid Category
- **Factual Associations**: 25% (green bar, medium height).
- **Associated Hallucinations**: 6% (blue bar, medium height).
- **Unassociated Hallucinations**: 70% (red bar, tallest in group).
#### High Category
- **Factual Associations**: 48% (green bar, tallest in group).
- **Associated Hallucinations**: 12% (blue bar, medium height).
- **Unassociated Hallucinations**: 40% (red bar, shortest in group).
### Key Observations
1. **Unassociated Hallucinations Dominance**:
- In **Low** and **Mid** categories, red bars (Unassociated Hallucinations) dominate, accounting for 93% and 70%, respectively.
2. **Factual Associations Growth**:
- Green bars (Factual Associations) increase steadily from 5% (Low) to 48% (High), becoming the tallest in the **High** category.
3. **Associated Hallucinations Trend**:
- Blue bars (Associated Hallucinations) show a moderate increase from 2% (Low) to 12% (High), but remain the smallest in all groups.
4. **Inverse Relationship**:
- As Factual Associations rise, Unassociated Hallucinations decline sharply (93% → 40% across Low → High).
### Interpretation
The data suggests a **category-dependent performance metric**:
- **Low Category**: Poor factual grounding (5%) and high unassociated hallucinations (93%), indicating significant irrelevance or error.
- **Mid Category**: Moderate improvement in factual associations (25%) but still reliant on unassociated hallucinations (70%).
- **High Category**: Strong factual grounding (48%) with reduced unassociated hallucinations (40%), though associated hallucinations persist at 12%.
**Notable Patterns**:
- The **inverse correlation** between Factual Associations and Unassociated Hallucinations implies that higher categories prioritize accuracy over speculative or irrelevant outputs.
- **Associated Hallucinations** remain a consistent but minor factor across all categories, suggesting they are less impactful than unassociated errors.
**Implications**:
- The chart likely reflects a system's performance (e.g., AI model, data analysis tool) where "High" categories represent optimized or advanced settings, while "Low" categories indicate baseline or unrefined outputs. The decline in unassociated hallucinations with increasing category suggests improved relevance or precision in higher tiers.