# Technical Document Extraction: Hallucination and Association Analysis
## 1. Image Overview
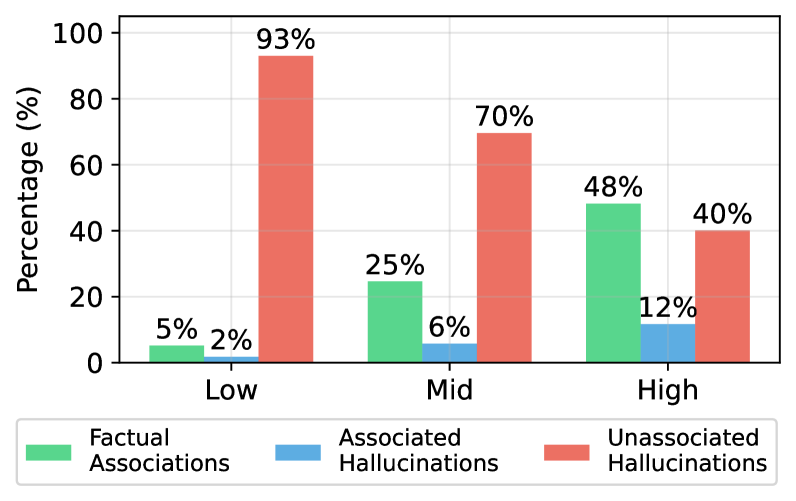
This image is a grouped bar chart illustrating the relationship between three categories of data—**Factual Associations**, **Associated Hallucinations**, and **Unassociated Hallucinations**—across three distinct levels of a variable: **Low**, **Mid**, and **High**.
## 2. Component Isolation
### A. Header / Axis Labels
* **Y-Axis Title:** Percentage (%)
* **Y-Axis Markers:** 0, 20, 40, 60, 80, 100
* **X-Axis Categories:** Low, Mid, High
### B. Main Chart Area
The chart contains three groups of bars. Each group contains three bars color-coded to match the legend. Numerical data labels are placed directly above each bar for precision.
### C. Legend (Footer)
* **Location:** Bottom of the image, centered horizontally.
* **Green (Hex approx #58D68D):** Factual Associations
* **Blue (Hex approx #5DADE2):** Associated Hallucinations
* **Red/Salmon (Hex approx #EC7063):** Unassociated Hallucinations
---
## 3. Data Table Reconstruction
| Category Level | Factual Associations (Green) | Associated Hallucinations (Blue) | Unassociated Hallucinations (Red) |
| :--- | :---: | :---: | :---: |
| **Low** | 5% | 2% | 93% |
| **Mid** | 25% | 6% | 70% |
| **High** | 48% | 12% | 40% |
---
## 4. Trend Verification and Analysis
### Series 1: Factual Associations (Green)
* **Visual Trend:** The bars show a strong, consistent upward slope from left to right.
* **Data Points:** Starts at a negligible 5% (Low), increases to 25% (Mid), and reaches its peak at 48% (High).
* **Observation:** Factual associations correlate positively with the X-axis levels.
### Series 2: Associated Hallucinations (Blue)
* **Visual Trend:** The bars show a gradual upward slope. While the values remain the lowest in every category, the growth is proportional.
* **Data Points:** 2% (Low) $\rightarrow$ 6% (Mid) $\rightarrow$ 12% (High).
* **Observation:** This series doubles at each step, indicating a geometric growth pattern, though it remains a minority component.
### Series 3: Unassociated Hallucinations (Red)
* **Visual Trend:** The bars show a strong downward slope from left to right.
* **Data Points:** Starts as the dominant majority at 93% (Low), drops to 70% (Mid), and falls to its lowest point of 40% (High).
* **Observation:** Unassociated hallucinations correlate negatively with the X-axis levels.
---
## 5. Summary of Findings
The chart demonstrates an inverse relationship between "Factual Associations" and "Unassociated Hallucinations." At the **Low** level, the system is dominated by unassociated hallucinations (93%). As the level progresses to **High**, the factual accuracy increases significantly (reaching 48%), while unassociated hallucinations drop by more than half (to 40%). "Associated Hallucinations" remain the smallest factor throughout but increase in frequency as factual associations increase.