\n
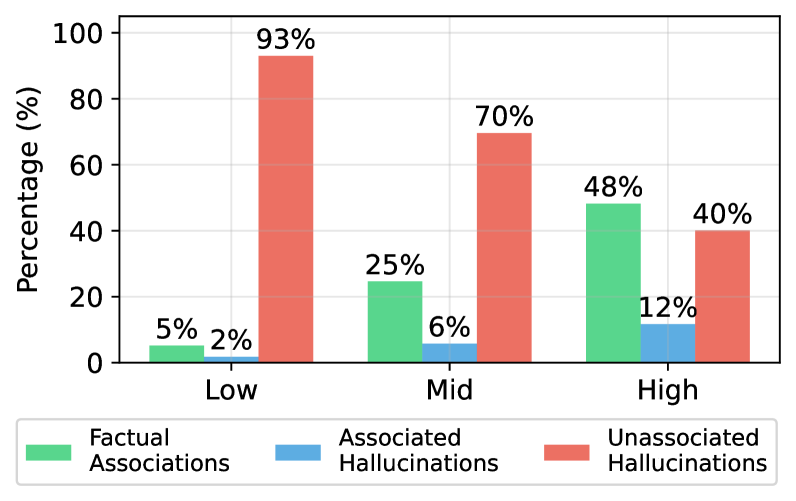
## Bar Chart: Hallucination Rates by Factual Association Level
### Overview
This bar chart displays the percentage of hallucinations (categorized as "Associated Hallucinations" and "Unassociated Hallucinations") and "Factual Associations" across three levels: "Low", "Mid", and "High". The y-axis represents the percentage, ranging from 0% to 100%. The x-axis represents the level of factual association.
### Components/Axes
* **X-axis:** "Factual Association Level" with categories: "Low", "Mid", "High".
* **Y-axis:** "Percentage (%)" with a scale from 0 to 100, incrementing by 20.
* **Legend:** Located at the bottom of the chart, identifying the three data series:
* "Factual Associations" (represented by a teal/light green color)
* "Associated Hallucinations" (represented by a light blue color)
* "Unassociated Hallucinations" (represented by a coral/red color)
### Detailed Analysis
The chart consists of three groups of bars, one for each level of factual association ("Low", "Mid", "High"). Within each group, there are three bars representing the percentage for each of the three data series.
* **Low:**
* Factual Associations: Approximately 5% (teal bar)
* Associated Hallucinations: Approximately 2% (light blue bar)
* Unassociated Hallucinations: Approximately 93% (coral/red bar)
* **Mid:**
* Factual Associations: Approximately 25% (teal bar)
* Associated Hallucinations: Approximately 6% (light blue bar)
* Unassociated Hallucinations: Approximately 70% (coral/red bar)
* **High:**
* Factual Associations: Approximately 48% (teal bar)
* Associated Hallucinations: Approximately 12% (light blue bar)
* Unassociated Hallucinations: Approximately 40% (coral/red bar)
The "Unassociated Hallucinations" bar dominates at the "Low" level, decreasing as the "Factual Association Level" increases. The "Factual Associations" bar increases steadily from "Low" to "High". The "Associated Hallucinations" bar remains relatively low across all levels, with a slight increase from "Low" to "High".
### Key Observations
* The percentage of "Unassociated Hallucinations" is significantly higher at the "Low" factual association level (93%) compared to the "Mid" (70%) and "High" (40%) levels.
* The percentage of "Factual Associations" increases as the factual association level increases, suggesting a positive correlation.
* "Associated Hallucinations" remain a small percentage across all levels.
### Interpretation
The data suggests that as the level of factual association increases, the prevalence of unassociated hallucinations decreases, while the prevalence of factual associations increases. This could indicate that hallucinations are less likely to occur when there is a stronger grounding in factual information. The relatively low percentage of associated hallucinations suggests that hallucinations are more often unrelated to factual context than directly linked to it. The chart highlights a potential relationship between factual grounding and the nature of hallucinations, suggesting that interventions aimed at strengthening factual associations might reduce the occurrence of unassociated hallucinations. The steep drop in unassociated hallucinations from "Low" to "Mid" factual association is a particularly notable trend, suggesting a critical threshold effect.