\n
## Grouped Bar Chart: Distribution of Association Types Across Three Levels
### Overview
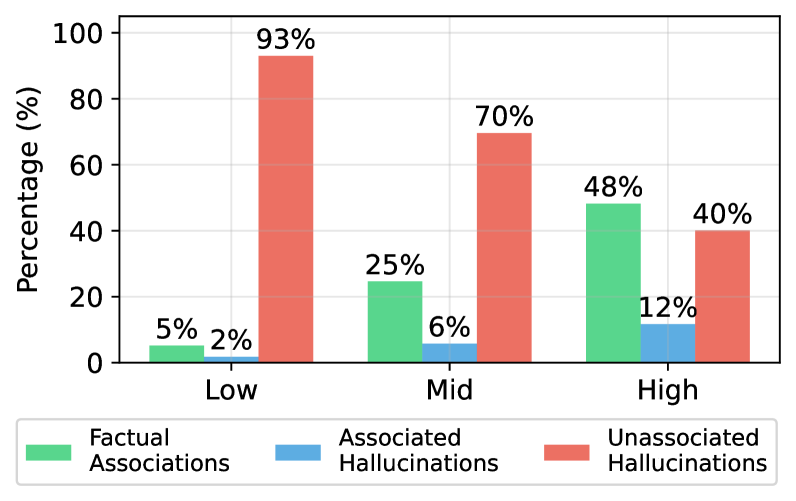
This is a grouped bar chart displaying the percentage distribution of three distinct types of associations (Factual Associations, Associated Hallucinations, and Unassociated Hallucinations) across three categorical levels: Low, Mid, and High. The chart compares how the prevalence of these association types changes across the levels.
### Components/Axes
* **X-Axis (Horizontal):** Categorical axis labeled with three levels: "Low", "Mid", and "High".
* **Y-Axis (Vertical):** Numerical axis labeled "Percentage (%)" with a scale from 0 to 100, marked at intervals of 20 (0, 20, 40, 60, 80, 100).
* **Legend:** Positioned at the bottom of the chart. It defines three data series by color:
* **Green Bar:** "Factual Associations"
* **Blue Bar:** "Associated Hallucinations"
* **Red Bar:** "Unassociated Hallucinations"
### Detailed Analysis
The data is presented in three groups, one for each level on the x-axis. Each group contains three bars corresponding to the legend.
**1. Low Level Group (Leftmost):**
* **Factual Associations (Green):** 5%
* **Associated Hallucinations (Blue):** 2%
* **Unassociated Hallucinations (Red):** 93%
* *Trend Verification:* The red bar is overwhelmingly dominant, while the green and blue bars are minimal.
**2. Mid Level Group (Center):**
* **Factual Associations (Green):** 25%
* **Associated Hallucinations (Blue):** 6%
* **Unassociated Hallucinations (Red):** 70%
* *Trend Verification:* The red bar remains the largest but has decreased significantly from the Low level. The green bar has increased notably, and the blue bar shows a slight increase.
**3. High Level Group (Rightmost):**
* **Factual Associations (Green):** 48%
* **Associated Hallucinations (Blue):** 12%
* **Unassociated Hallucinations (Red):** 40%
* *Trend Verification:* The green bar is now the largest in this group, having increased steadily from Low to High. The red bar has continued its downward trend. The blue bar shows its highest value here.
### Key Observations
1. **Dominant Inverse Trend:** There is a clear inverse relationship between "Factual Associations" and "Unassociated Hallucinations" across the levels. As the level increases from Low to High, the percentage of Factual Associations rises sharply (5% → 25% → 48%), while the percentage of Unassociated Hallucinations falls sharply (93% → 70% → 40%).
2. **Minor Trend for Associated Hallucinations:** "Associated Hallucinations" show a modest but consistent upward trend across levels (2% → 6% → 12%).
3. **Shift in Dominance:** The dominant association type shifts from "Unassociated Hallucinations" at the Low level to "Factual Associations" at the High level.
4. **Magnitude of Change:** The most dramatic single change is the 45-percentage-point drop in Unassociated Hallucinations from the Low to the Mid level.
### Interpretation
The data suggests a strong correlation between the categorical level (Low, Mid, High) and the nature of the associations produced. The "Low" level is characterized almost exclusively by "Unassociated Hallucinations," implying a state where generated content is largely disconnected from factual input. As the level increases to "Mid" and then "High," there is a progressive shift towards more "Factual Associations," indicating improved grounding or accuracy. The concurrent, though smaller, rise in "Associated Hallucinations" suggests that as systems become more factually grounded, the errors they do make may become more subtly related to the input rather than completely unassociated.
This chart likely illustrates the performance or output characteristics of a system (e.g., an AI model) under different conditions or configurations labeled Low, Mid, and High. The key takeaway is that moving from the "Low" to "High" condition significantly reduces completely ungrounded errors (Unassociated Hallucinations) and increases factually correct outputs (Factual Associations).