## Chart Type: Line Graphs Comparing Verification Performance
### Overview
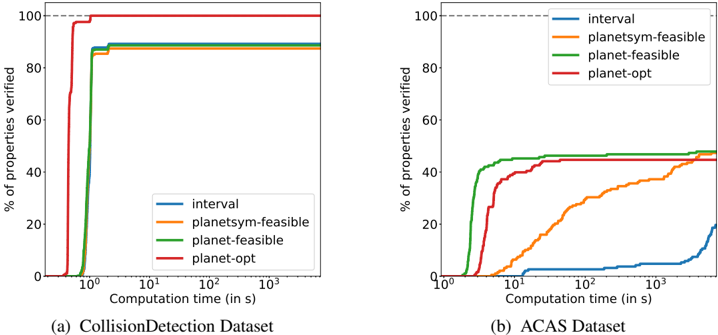
The image contains two line graphs comparing the percentage of properties verified against computation time for different verification methods. The left graph (a) shows results for the CollisionDetection Dataset, and the right graph (b) shows results for the ACAS Dataset. The x-axis (computation time) is logarithmic. The verification methods compared are "interval", "planetsym-feasible", "planet-feasible", and "planet-opt".
### Components/Axes
**Left Graph (CollisionDetection Dataset):**
* **Title:** (a) CollisionDetection Dataset
* **X-axis:** Computation time (in s) - Logarithmic scale with markers at 10<sup>0</sup>, 10<sup>1</sup>, 10<sup>2</sup>, and 10<sup>3</sup>.
* **Y-axis:** % of properties verified - Linear scale from 0 to 100. Markers at 0, 20, 40, 60, 80, and 100.
* **Legend (Top-Right):**
* Blue: interval
* Orange: planetsym-feasible
* Green: planet-feasible
* Red: planet-opt
* **Horizontal dashed line:** At 100%
**Right Graph (ACAS Dataset):**
* **Title:** (b) ACAS Dataset
* **X-axis:** Computation time (in s) - Logarithmic scale with markers at 10<sup>0</sup>, 10<sup>1</sup>, 10<sup>2</sup>, and 10<sup>3</sup>.
* **Y-axis:** % of properties verified - Linear scale from 0 to 100. Markers at 0, 20, 40, 60, 80, and 100.
* **Legend (Top-Right):**
* Blue: interval
* Orange: planetsym-feasible
* Green: planet-feasible
* Red: planet-opt
* **Horizontal dashed line:** At 100%
### Detailed Analysis
**Left Graph (CollisionDetection Dataset):**
* **interval (Blue):** The line starts at 0% and quickly rises to approximately 88% at around 10<sup>0</sup> seconds. It then remains relatively flat, reaching approximately 90% at 10<sup>3</sup> seconds.
* **planetsym-feasible (Orange):** The line starts at 0% and quickly rises to approximately 86% at around 10<sup>0</sup> seconds. It then gradually increases to approximately 88% at 10<sup>3</sup> seconds.
* **planet-feasible (Green):** The line starts at 0% and quickly rises to approximately 90% at around 10<sup>0</sup> seconds. It then remains relatively flat, reaching approximately 92% at 10<sup>3</sup> seconds.
* **planet-opt (Red):** The line starts at 0% and quickly rises to approximately 98% at around 10<sup>0</sup> seconds. It reaches 100% at around 10<sup>1</sup> seconds and remains there.
**Right Graph (ACAS Dataset):**
* **interval (Blue):** The line starts at 0% and slowly rises, reaching approximately 10% at 10<sup>3</sup> seconds.
* **planetsym-feasible (Orange):** The line starts at 0% and gradually rises, reaching approximately 45% at 10<sup>3</sup> seconds.
* **planet-feasible (Green):** The line starts at 0% and quickly rises to approximately 45% at around 10<sup>1</sup> seconds. It then gradually increases to approximately 50% at 10<sup>3</sup> seconds.
* **planet-opt (Red):** The line starts at 0% and rises to approximately 40% at around 10<sup>1</sup> seconds. It then gradually increases to approximately 50% at 10<sup>3</sup> seconds.
### Key Observations
* For the CollisionDetection Dataset, "planet-opt" achieves 100% verification much faster than the other methods. All methods perform well, quickly reaching high verification percentages.
* For the ACAS Dataset, all methods perform significantly worse than in the CollisionDetection Dataset. "interval" performs the worst, while "planet-feasible" and "planet-opt" perform similarly and slightly better than "planetsym-feasible".
### Interpretation
The graphs illustrate the performance of different verification methods on two datasets. The "planet-opt" method is highly effective for the CollisionDetection Dataset, achieving full verification quickly. However, the performance of all methods is significantly lower on the ACAS Dataset, suggesting that this dataset presents a more challenging verification problem. The difference in performance between the datasets highlights the importance of selecting appropriate verification methods based on the specific characteristics of the system being verified. The logarithmic scale of the x-axis indicates that the initial computation time is crucial for achieving a high percentage of verified properties.