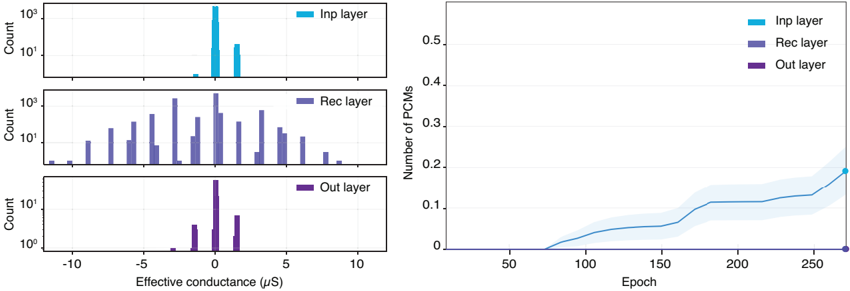
## Histograms and Line Graph: Layer Conductance and PCM Evolution
### Overview
The image contains two primary components:
1. **Three histograms** (left) showing the distribution of effective conductance (μS) for three neural network layers: Input (Inp), Recurrent (Rec), and Output (Out).
2. **A line graph** (right) tracking the number of PCMs (Phase Change Memory units) over training epochs for the same layers.
---
### Components/Axes
#### Histograms (Left)
- **X-axis**: Effective conductance (μS), ranging from -10 to +10.
- **Y-axis**: Count (log scale, 10⁰ to 10³).
- **Legends**:
- Cyan: Inp layer
- Blue: Rec layer
- Purple: Out layer
#### Line Graph (Right)
- **X-axis**: Epoch (0 to 250).
- **Y-axis**: Number of PCMs (0 to 0.5).
- **Legends**:
- Cyan: Inp layer
- Blue: Rec layer
- Purple: Out layer
---
### Detailed Analysis
#### Histograms
1. **Inp Layer (Cyan)**:
- Single dominant peak at **~8 μS** with a count of **~1,000**.
- No other significant peaks; distribution is narrow.
2. **Rec Layer (Blue)**:
- Two peaks:
- **~ -5 μS** with count **~500**.
- **~ +2 μS** with count **~300**.
- Broader distribution compared to Inp layer.
3. **Out Layer (Purple)**:
- Two peaks:
- **~0 μS** with count **~100**.
- **~+3 μS** with count **~50**.
- Distribution is bimodal and less concentrated than Inp/Rec layers.
#### Line Graph
1. **Inp Layer (Cyan)**:
- Steady increase from **0 PCMs** at epoch 0 to **~0.25 PCMs** at epoch 250.
- Shaded area (confidence interval) widens slightly over time.
2. **Rec Layer (Blue)**:
- Remains **flat at ~0 PCMs** throughout all epochs.
3. **Out Layer (Purple)**:
- Slight upward trend from **0 PCMs** to **~0.05 PCMs** by epoch 250.
- Shaded area remains narrow, indicating low variability.
---
### Key Observations
1. **Conductance Distribution**:
- Inp layer exhibits the highest conductance values (peak at 8 μS), suggesting stronger synaptic connections.
- Rec layer shows mixed polarity (negative and positive peaks), indicating diverse synaptic weights.
- Out layer has lower conductance magnitudes, with a bimodal distribution centered near 0 μS.
2. **PCM Evolution**:
- Inp layer’s PCM count grows linearly, implying increasing memory unit utilization or connectivity.
- Rec layer’s stagnation suggests no significant changes in memory unit dynamics.
- Out layer’s minimal growth may reflect limited plasticity or stabilization post-training.
---
### Interpretation
- **Conductance Trends**: The Inp layer’s high conductance aligns with its role in receiving external inputs, while the Rec layer’s mixed polarity reflects internal feedback mechanisms. The Out layer’s low conductance may indicate specialized, sparse connectivity for output generation.
- **PCM Dynamics**: The Inp layer’s rising PCM count could correlate with enhanced learning capacity or memory consolidation. The Rec layer’s stability might indicate a fixed internal state, while the Out layer’s slow growth suggests gradual adaptation.
- **Anomalies**: The Rec layer’s negative conductance peak (-5 μS) is unusual, potentially indicating inhibitory synaptic pathways or data artifacts.
This analysis highlights how layer-specific properties (conductance, PCM growth) evolve during training, offering insights into neural network architecture and learning dynamics.