## Diagram: Actor-Critic Model with Preference Data
### Overview
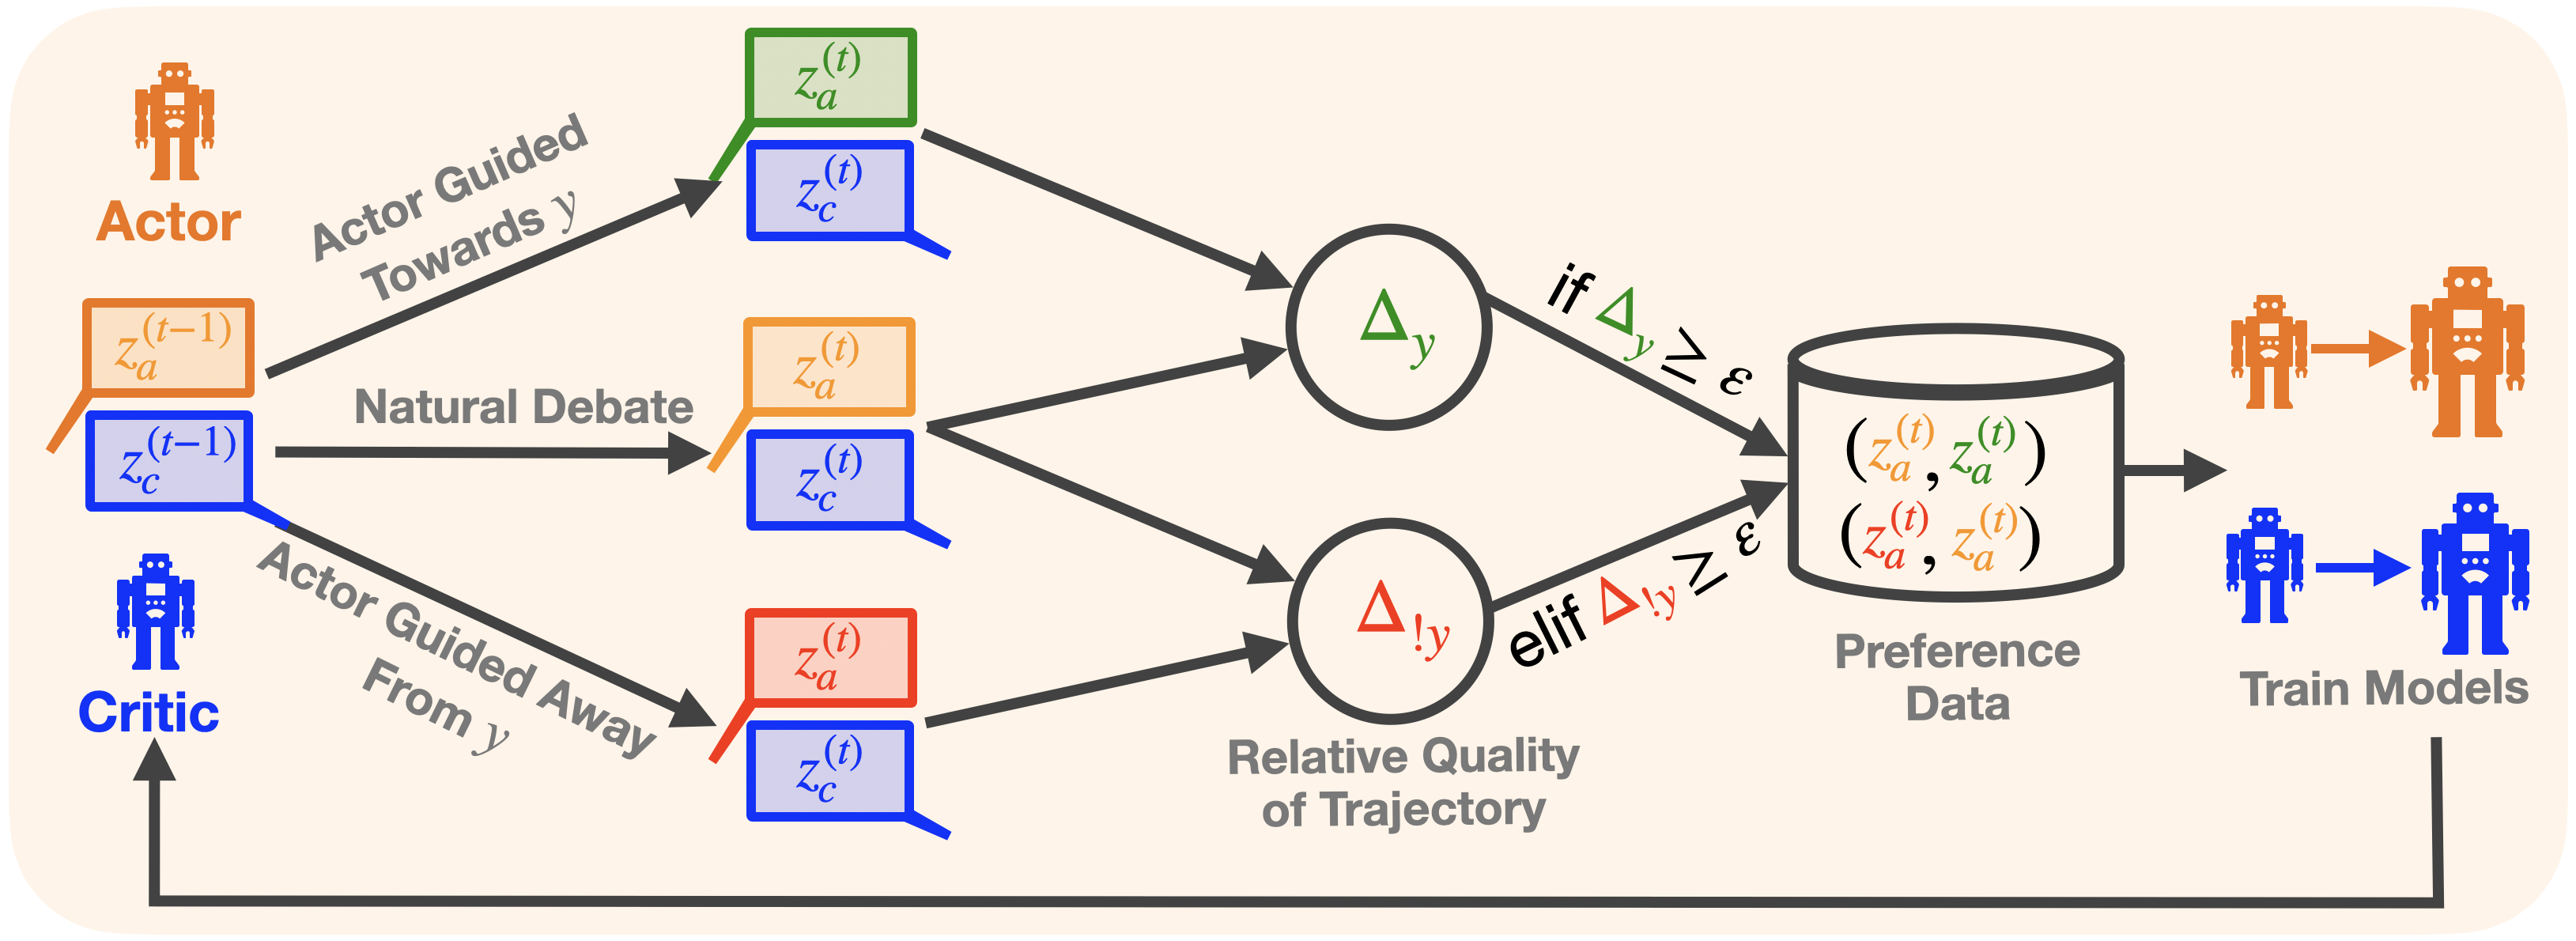
The image illustrates a diagram of an actor-critic model that incorporates preference data for training. The diagram shows the flow of information between the actor and critic, and how their interactions influence the generation of preference data used to train the models.
### Components/Axes
* **Actor:** Represented by an orange robot icon.
* `z_a^(t-1)`: Actor's state at time t-1 (orange box with orange outline).
* `z_a^(t)`: Actor's state at time t (green, orange, or red box with matching outline).
* **Critic:** Represented by a blue robot icon.
* `z_c^(t-1)`: Critic's state at time t-1 (blue box with blue outline).
* `z_c^(t)`: Critic's state at time t (blue box with blue outline).
* **Actor Guided Towards y:** Text label indicating the actor's actions are guided towards a target 'y'.
* **Natural Debate:** Text label indicating a natural debate between the actor and critic.
* **Actor Guided Away From y:** Text label indicating the actor's actions are guided away from a target 'y'.
* **Δy:** Green circle containing the delta y symbol.
* **Δ!y:** Red circle containing the delta !y symbol.
* **Relative Quality of Trajectory:** Text label indicating the relative quality of the trajectory.
* **Preference Data:** Represents a database or storage of preference data. Contains tuples of actor states: `(z_a^(t), z_a^(t))`
* **Train Models:** Indicates the training of models using the preference data.
* **ε:** Epsilon, a threshold value.
* **if Δy ≥ ε:** Conditional statement.
* **elif Δ!y ≥ ε:** Conditional statement.
### Detailed Analysis
1. **Actor and Critic Interaction:**
* The diagram starts with the Actor and Critic at time `t-1`, represented by `z_a^(t-1)` (orange) and `z_c^(t-1)` (blue) respectively.
* The Actor's actions are guided "Towards y" and "Away From y", while a "Natural Debate" occurs between the Actor and Critic.
* At time `t`, the Actor's state `z_a^(t)` can be green, orange, or red, depending on the guidance. The Critic's state `z_c^(t)` remains blue.
2. **Trajectory Evaluation:**
* The trajectories are evaluated based on "Relative Quality of Trajectory", resulting in `Δy` (green) and `Δ!y` (red).
3. **Preference Data Generation:**
* If `Δy ≥ ε`, the tuple `(z_a^(t), z_a^(t))` (where `z_a^(t)` is green) is added to the "Preference Data".
* If `Δ!y ≥ ε`, the tuple `(z_a^(t), z_a^(t))` (where `z_a^(t)` is red) is added to the "Preference Data".
* The preference data consists of pairs of actor states at time t.
4. **Model Training:**
* The "Preference Data" is used to "Train Models", resulting in updated Actor (orange) and Critic (blue) models.
### Key Observations
* The Actor's state at time `t` (`z_a^(t)`) can be in one of three states (green, orange, or red), while the Critic's state at time `t` (`z_c^(t)`) is always blue.
* The preference data is generated based on the relative quality of the trajectory, as determined by `Δy` and `Δ!y`.
* The conditional statements `if Δy ≥ ε` and `elif Δ!y ≥ ε` determine which trajectories are used to generate preference data.
### Interpretation
The diagram illustrates a reinforcement learning process where an actor and critic interact to generate trajectories. The relative quality of these trajectories is evaluated, and preference data is created based on this evaluation. This preference data is then used to train the actor and critic models. The use of preference data allows the models to learn from successful and unsuccessful trajectories, improving their performance over time. The thresholds `ε` determine the sensitivity of the preference data generation process.