## Bar Chart: Multimodal Troubleshooting Virology
### Overview
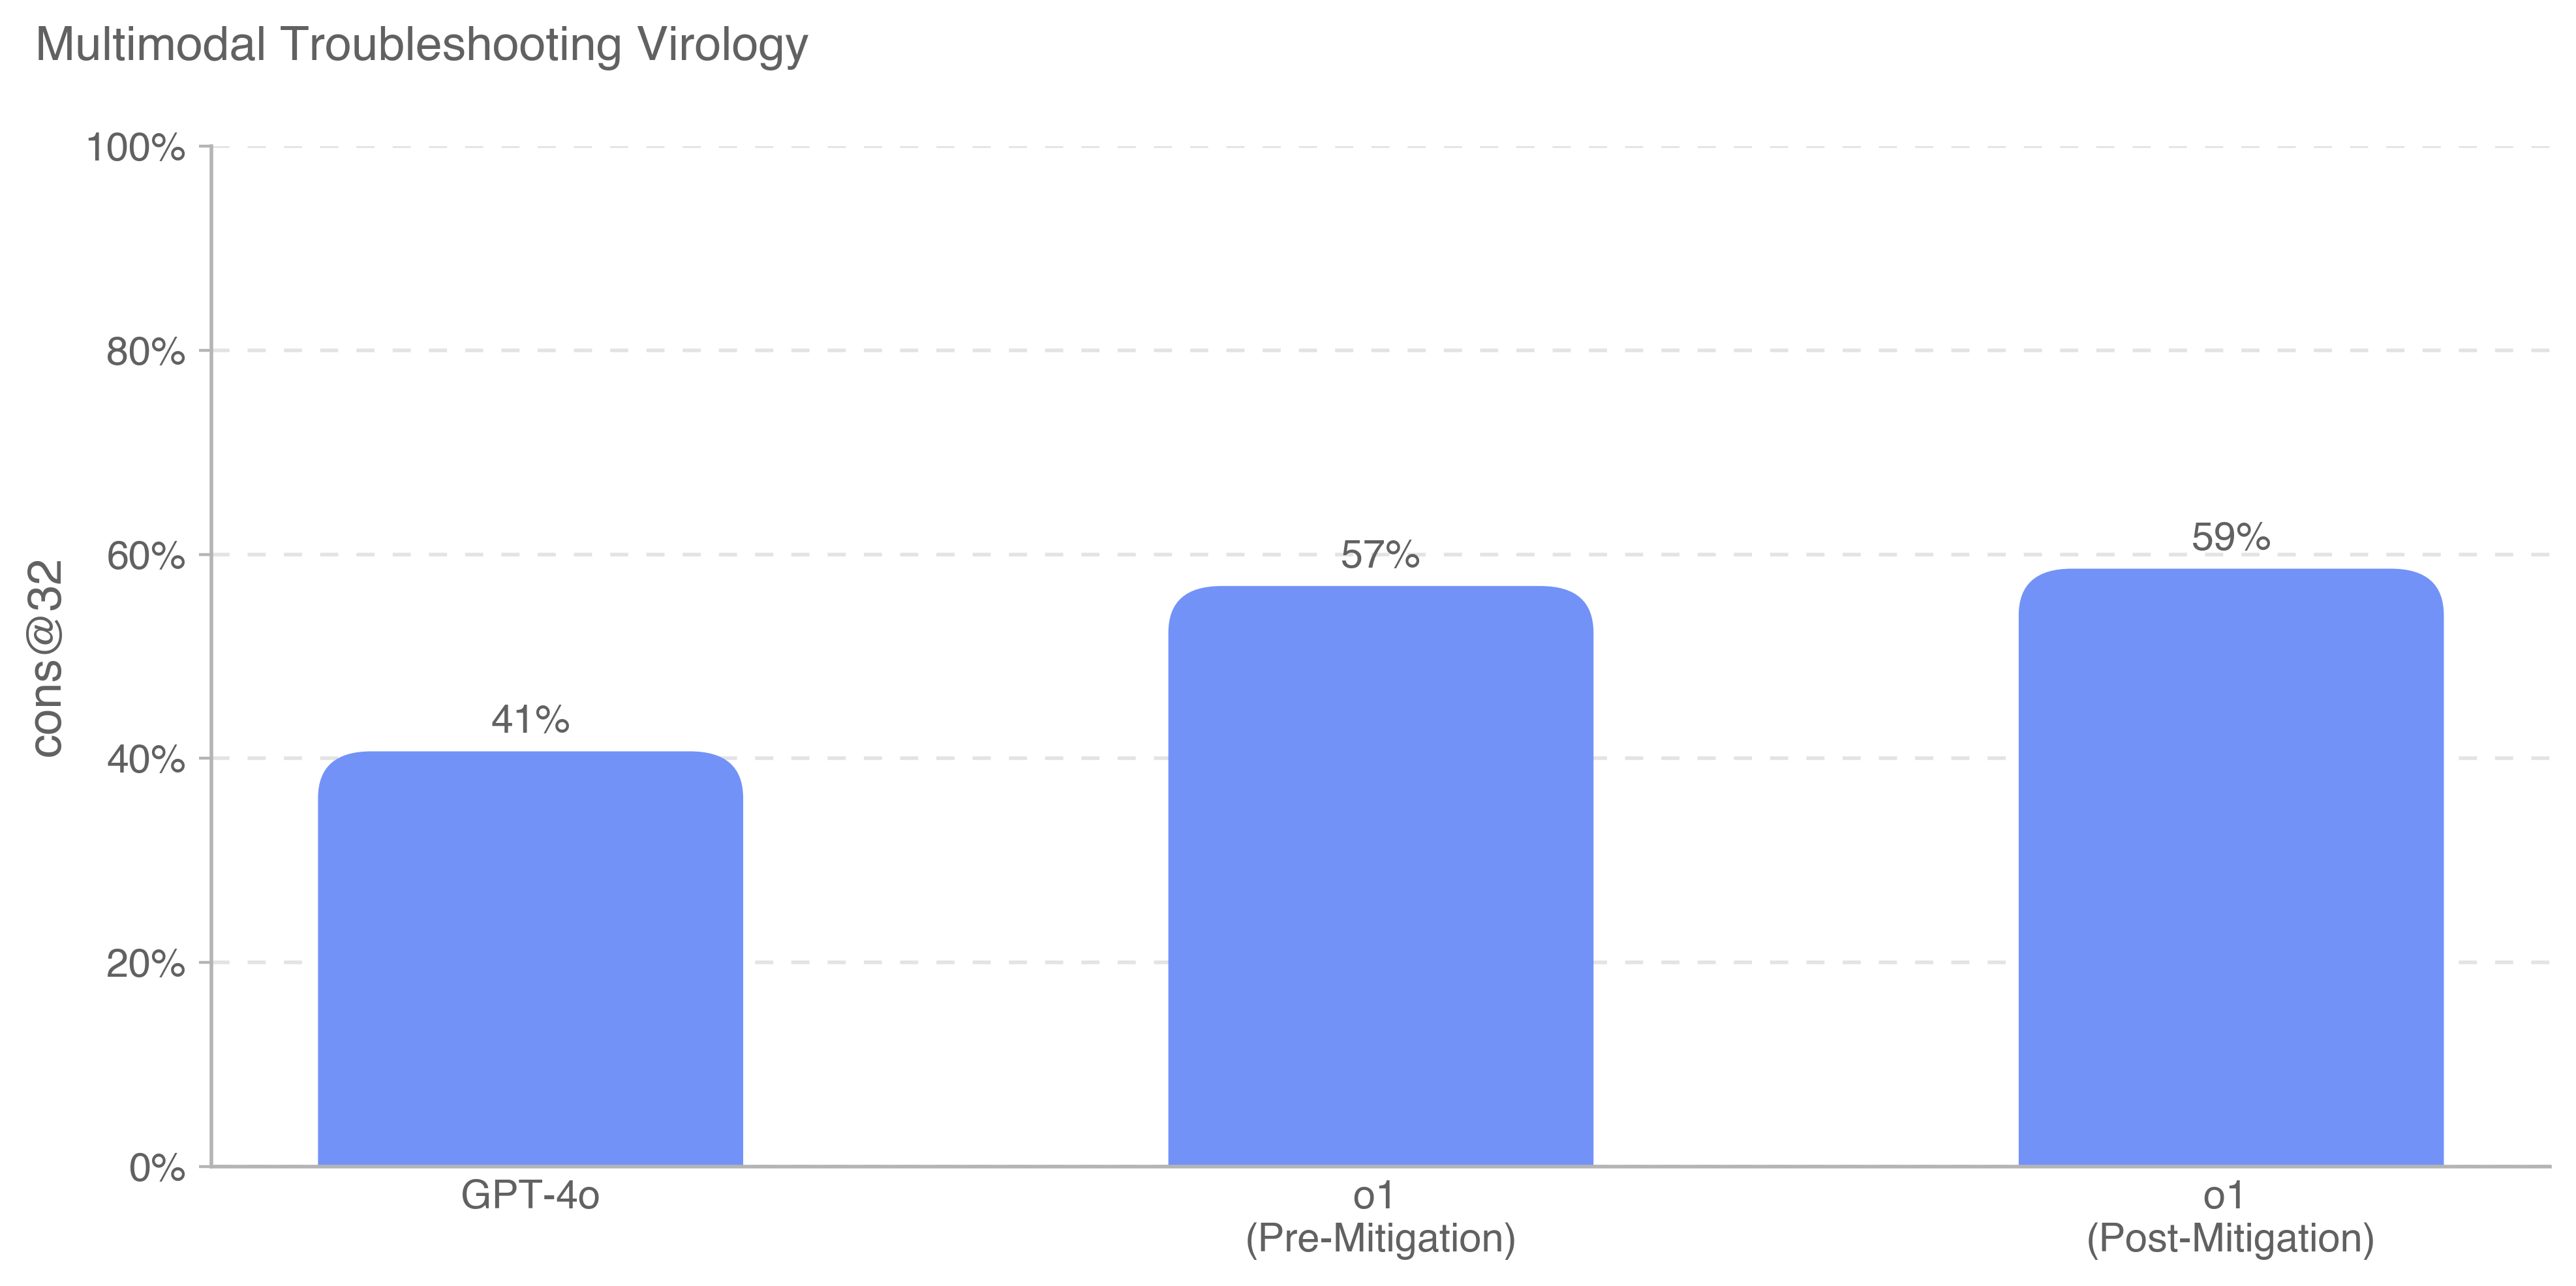
The image is a bar chart comparing the performance of GPT-4o and o1 (pre- and post-mitigation) on a task, measured by "cons@32". The y-axis represents percentage values from 0% to 100%. The chart shows that o1's performance improves after mitigation.
### Components/Axes
* **Title:** Multimodal Troubleshooting Virology
* **Y-axis:**
* Label: cons@32
* Scale: 0%, 20%, 40%, 60%, 80%, 100%
* **X-axis:**
* Categories: GPT-4o, o1 (Pre-Mitigation), o1 (Post-Mitigation)
* **Bars:** All bars are light blue.
### Detailed Analysis
* **GPT-4o:** The bar for GPT-4o reaches 41%.
* **o1 (Pre-Mitigation):** The bar for o1 (Pre-Mitigation) reaches 57%.
* **o1 (Post-Mitigation):** The bar for o1 (Post-Mitigation) reaches 59%.
### Key Observations
* o1's performance is significantly lower than GPT-4o before mitigation (41% vs 57%).
* Mitigation efforts lead to a slight improvement in o1's performance (57% to 59%).
* GPT-4o has the lowest performance of the three.
### Interpretation
The chart suggests that the mitigation strategy applied to "o1" had a positive, albeit small, impact on its performance. However, the initial performance of "o1" was already higher than that of "GPT-4o". The data implies that "o1" benefits from the mitigation strategy, but the improvement is marginal. Further investigation may be needed to understand why "GPT-4o" performs lower than "o1" and to explore more effective mitigation strategies for "o1".