\n
## Bar Chart: Multimodal Troubleshooting Virology
### Overview
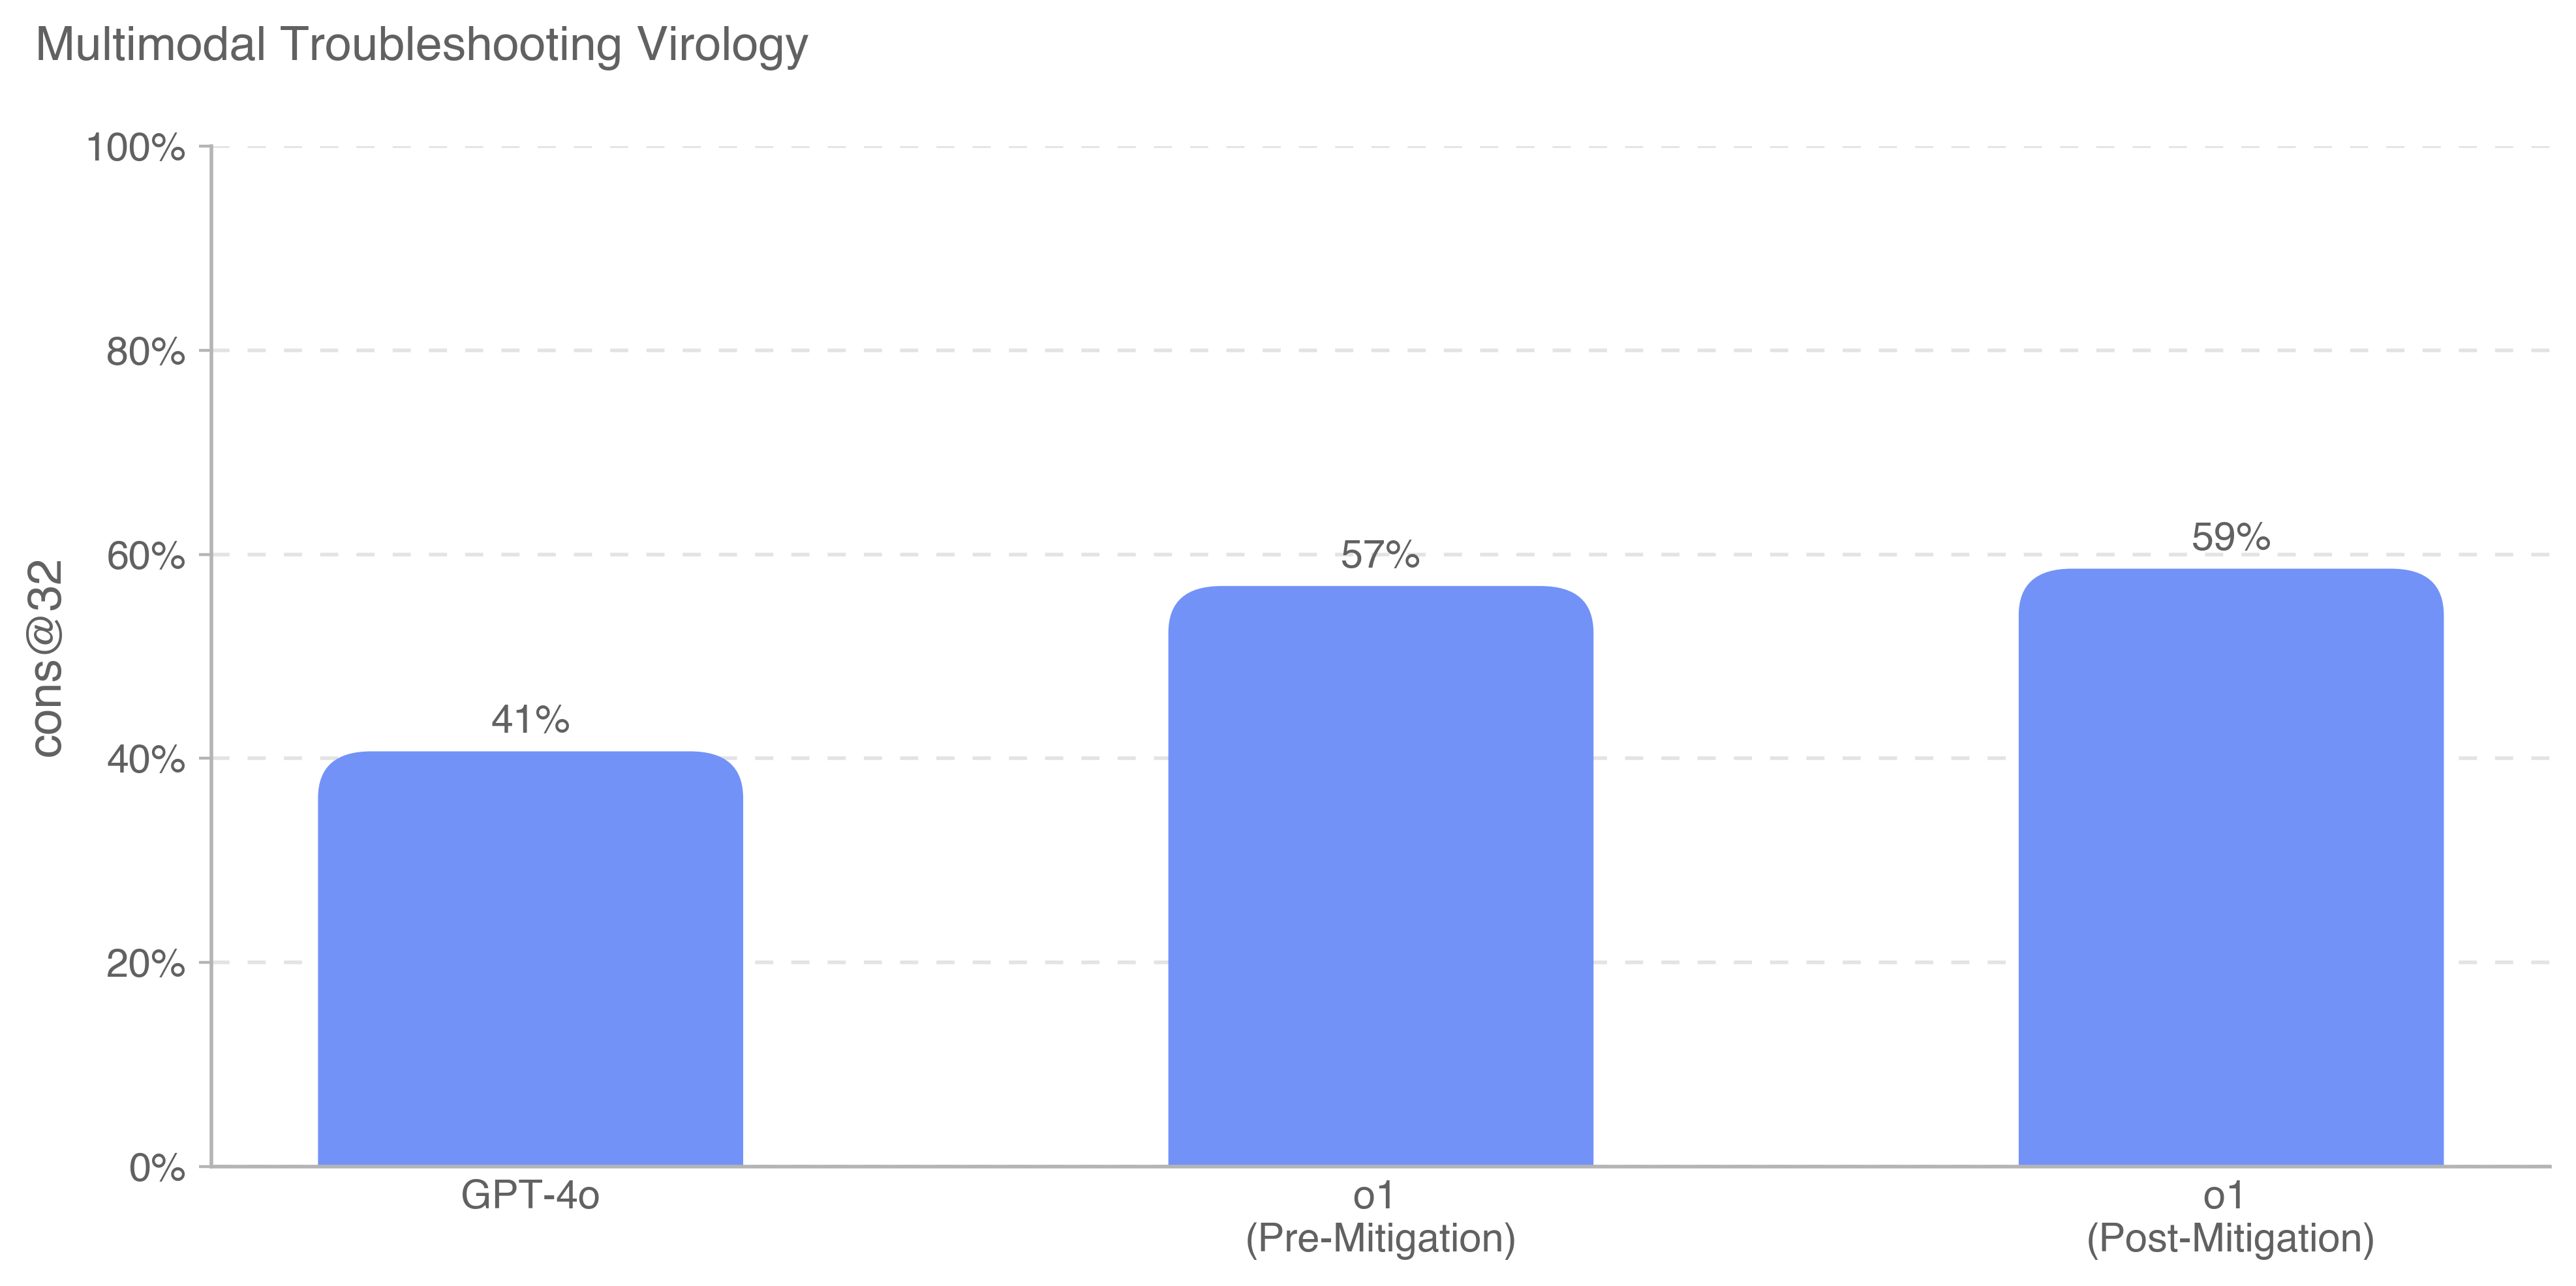
This is a bar chart comparing the performance of GPT-4o and a model labeled "o1" (before and after mitigation) on a "Multimodal Troubleshooting Virology" task. The performance metric is "cons@32", presumably representing a consistency score at a certain level of complexity.
### Components/Axes
* **Title:** Multimodal Troubleshooting Virology
* **X-axis:** Represents the models being compared: GPT-4o, o1 (Pre-Mitigation), o1 (Post-Mitigation).
* **Y-axis:** Represents the "cons@32" score, ranging from 0% to 100%, with tick marks at 0%, 20%, 40%, 60%, 80%, and 100%.
* **Bars:** Three vertical bars representing the performance of each model. The bars are colored in a light blue shade.
* **Data Labels:** Each bar is labeled with its corresponding "cons@32" percentage.
### Detailed Analysis
* **GPT-4o:** The bar for GPT-4o reaches approximately 41% on the y-axis.
* **o1 (Pre-Mitigation):** The bar for o1 (Pre-Mitigation) reaches approximately 57% on the y-axis.
* **o1 (Post-Mitigation):** The bar for o1 (Post-Mitigation) reaches approximately 59% on the y-axis.
The bars are positioned sequentially along the x-axis, with GPT-4o on the left, followed by o1 (Pre-Mitigation), and then o1 (Post-Mitigation). The height of each bar corresponds to its "cons@32" score.
### Key Observations
* GPT-4o has the lowest "cons@32" score at 41%.
* The "o1" model shows an improvement in "cons@32" after mitigation, increasing from 57% to 59%.
* The difference between the pre- and post-mitigation performance of "o1" is relatively small (2 percentage points).
* Both "o1" models outperform GPT-4o.
### Interpretation
The data suggests that the "o1" model, particularly after mitigation, performs better than GPT-4o on the "Multimodal Troubleshooting Virology" task, as measured by the "cons@32" metric. The mitigation process applied to the "o1" model resulted in a slight improvement in performance. The relatively small difference between the pre- and post-mitigation scores suggests that the initial issues addressed by the mitigation were not the primary drivers of performance. The "cons@32" metric likely assesses the consistency of the model's responses or solutions, and the higher scores for "o1" indicate a more reliable or stable performance in this specific virology troubleshooting context. It is important to note that this is a single metric and does not provide a complete picture of the models' capabilities. Further analysis with other metrics would be needed to draw more comprehensive conclusions.