## Bar Chart: Multimodal Troubleshooting Virology
### Overview
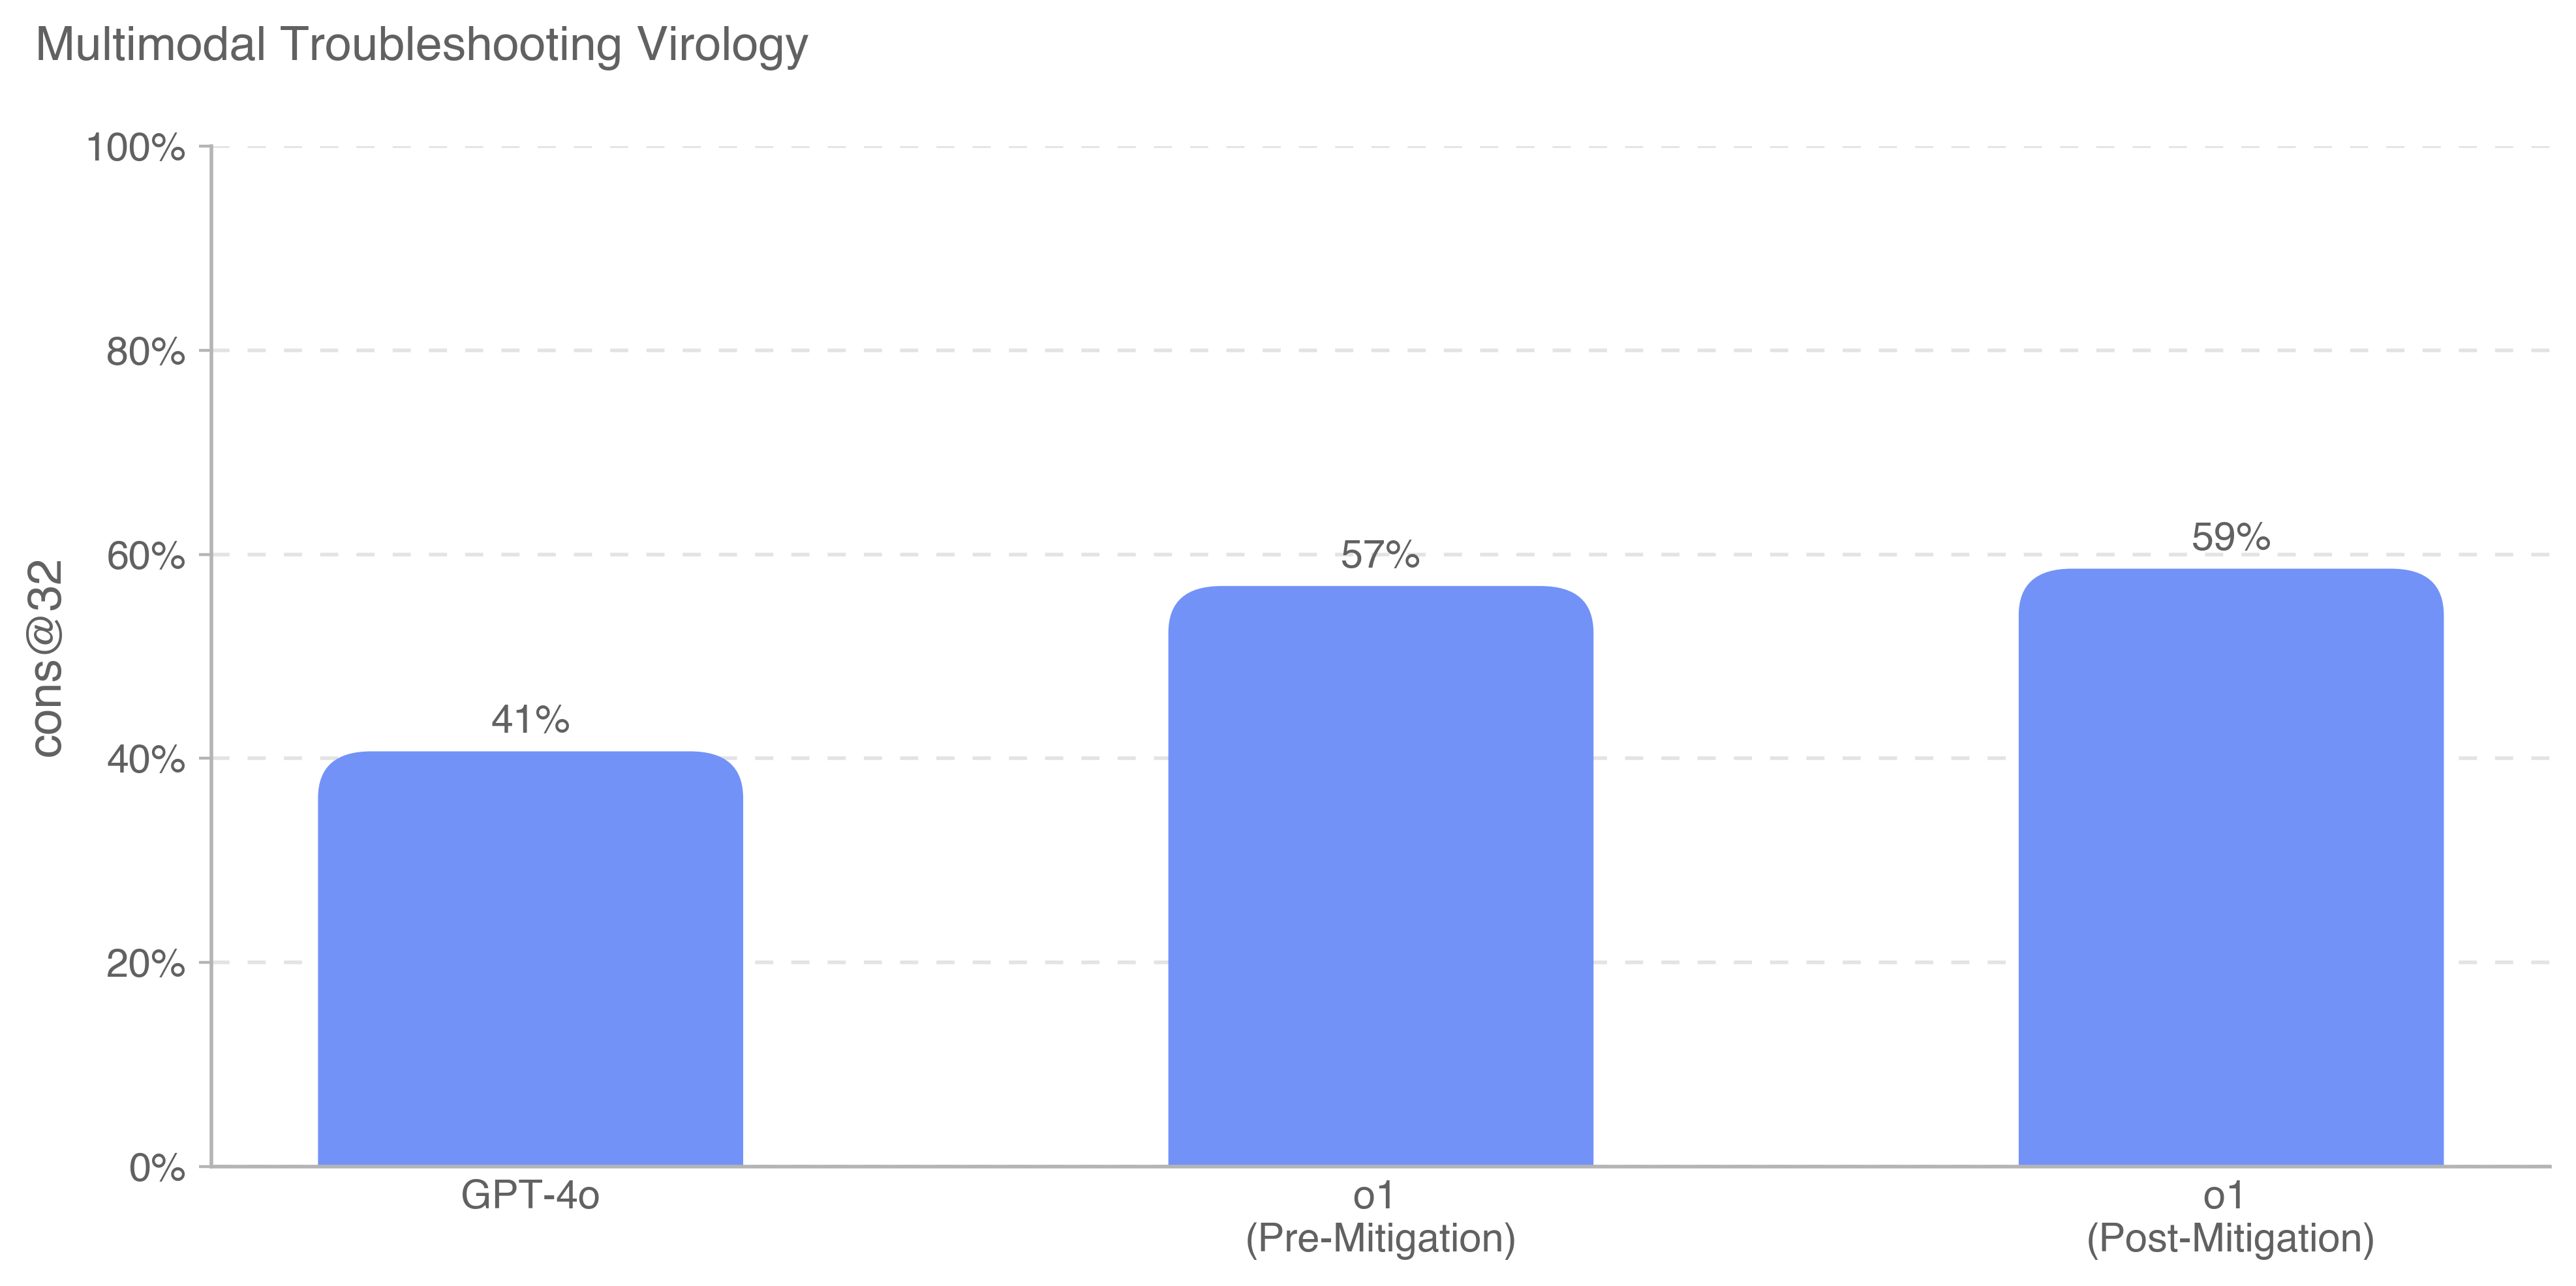
The chart compares performance metrics (cons@32) across three model configurations: GPT-4o, o1 (Pre-Mitigation), and o1 (Post-Mitigation). It uses vertical bars to represent percentage values, with a focus on improvements before and after mitigation.
### Components/Axes
- **Title**: "Multimodal Troubleshooting Virology" (top-center)
- **Y-Axis**:
- Label: "cons@32" (percentage scale)
- Range: 0% to 100% in 20% increments
- Position: Left side of chart
- **X-Axis**:
- Categories:
1. GPT-4o
2. o1 (Pre-Mitigation)
3. o1 (Post-Mitigation)
- Position: Bottom of chart
- **Legend**:
- Single entry: Blue color corresponds to all categories
- Position: Right side of chart
- **Bars**:
- Color: Blue (consistent across all categories)
- Values:
- GPT-4o: 41%
- o1 (Pre-Mitigation): 57%
- o1 (Post-Mitigation): 59%
### Detailed Analysis
- **GPT-4o**: Shortest bar at 41% (bottom-left quadrant)
- **o1 (Pre-Mitigation)**: Middle bar at 57% (center-right quadrant)
- **o1 (Post-Mitigation)**: Tallest bar at 59% (top-right quadrant)
- **Trend**:
- Visual progression: GPT-4o → o1 Pre-Mitigation → o1 Post-Mitigation shows a steady increase
- Numerical verification: 41% → 57% (+16%) → 59% (+2%)
### Key Observations
1. **Mitigation Impact**:
- Pre-Mitigation (57%) shows significant improvement over GPT-4o (41%)
- Post-Mitigation (59%) achieves marginal gains over Pre-Mitigation
2. **Performance Ceiling**:
- Post-Mitigation represents the highest observed performance (59%)
3. **Consistency**:
- All values use the same metric (cons@32) for direct comparison
### Interpretation
The data demonstrates that mitigation strategies (o1) improve multimodal troubleshooting performance in virology applications. The 16% jump from GPT-4o to Pre-Mitigation suggests foundational issues in the base model architecture, while the 2% gain from Pre- to Post-Mitigation indicates refined optimization opportunities. The consistent use of cons@32 as the evaluation metric allows direct comparison across configurations, though the plateau at 59% suggests potential limitations in current mitigation approaches. This pattern aligns with typical machine learning system improvements where initial architectural changes yield larger gains than subsequent fine-tuning.