## Diagram: Sequential and Counterfactual Reasoning Models
### Overview
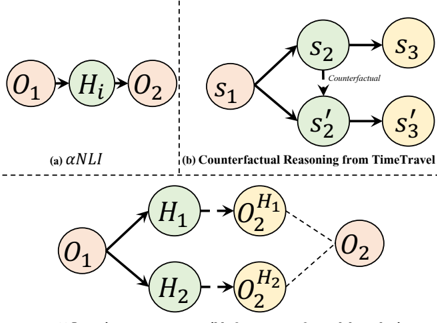
The image presents three interconnected diagrams (a, b, c) illustrating hypothetical reasoning processes involving observations (O), hypotheses (H), and states (S). Arrows represent causal or inferential relationships, with labels indicating specific reasoning mechanisms (e.g., "αNLI," "Counterfactual").
### Components/Axes
- **Nodes**:
- **Observations (O)**: Labeled as *O₁*, *O₂*, *O'₁*, *O'₂* (primed variants suggest counterfactual outcomes).
- **Hypotheses (H)**: Labeled as *H₁*, *H₂*, *Hᵢ* (subscript *i* implies variable indexing).
- **States (S)**: Labeled as *S₁*, *S₂*, *S₃*, *S'₂*, *S'₃* (primed variants denote altered states).
- **Arrows**:
- Solid arrows indicate direct causal/inferential links.
- Dashed arrows (e.g., in diagram b) represent counterfactual or hypothetical pathways.
- **Labels**:
- Diagram (a): "αNLI" (likely a reasoning method).
- Diagram (b): "Counterfactual" (explicitly labeled on a dashed arrow).
### Detailed Analysis
#### Diagram (a): αNLI
- **Flow**: *O₁* → *Hᵢ* → *O₂*.
- **Interpretation**: A standard inference chain where observation *O₁* leads to hypothesis *Hᵢ*, which in turn predicts observation *O₂*.
#### Diagram (b): Counterfactual Reasoning from TimeTravel
- **Flow**:
- *S₁* → *S₂* → *S₃* (primary causal path).
- *S₂* → *S'₃* (counterfactual path, dashed arrow).
- **Key Elements**:
- The counterfactual arrow from *S₂* to *S'₃* suggests exploring alternative outcomes if *S₂* were modified.
- *S'₂* and *S'₃* are primed states, indicating deviations from the original trajectory.
#### Diagram (c): Hypothesis Branching
- **Flow**:
- *O₁* branches to *H₁* and *H₂*.
- *H₁* → *O'₁*, *H₂* → *O'₂*.
- **Interpretation**: A bifurcated hypothesis space where *O₁* generates two hypotheses (*H₁*, *H₂*), each leading to distinct counterfactual outcomes (*O'₁*, *O'₂*).
### Key Observations
1. **Counterfactuality**: Diagrams (b) and (c) explicitly model alternative outcomes (*S'₃*, *O'₁*, *O'₂*), suggesting a focus on "what-if" scenarios.
2. **Hypothesis-Driven Inference**: All diagrams emphasize hypotheses (*Hᵢ*, *H₁*, *H₂*) as intermediaries between observations and outcomes.
3. **State Transitions**: Diagram (b) introduces state transitions (*S₁* → *S₂* → *S₃*), implying temporal or sequential reasoning.
### Interpretation
The diagrams collectively model a framework for **counterfactual reasoning** in natural language inference (NLI). Diagram (a) represents baseline inference, while (b) and (c) extend this to explore hypothetical scenarios. The use of primed states (*S'*, *O'*) and dashed arrows highlights deviations from observed reality, aligning with time-travel-inspired reasoning. This structure could underpin systems that evaluate the robustness of hypotheses under altered conditions, critical for tasks like anomaly detection or speculative analysis.
No numerical data or trends are present; the focus is on conceptual relationships and reasoning pathways.