\n
## Diagram: Conceptual Models for Reasoning
### Overview
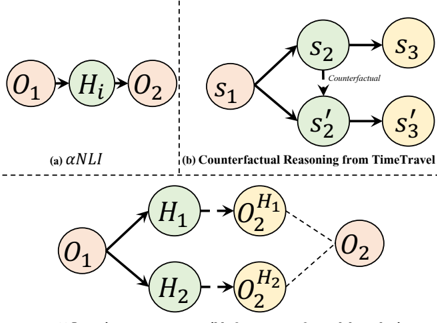
The image presents four distinct diagrams illustrating conceptual models for different reasoning approaches. The diagrams utilize nodes and directed edges to represent relationships between entities. The top-left diagram represents αNLI, the top-right represents Counterfactual Reasoning from TimeTravel, and the bottom two diagrams represent a model with branching hypotheses.
### Components/Axes
The diagrams consist of nodes (circles) and directed edges (arrows) connecting them. The nodes are filled with different colors: light orange, light green, and yellow. Each diagram is labeled with a letter and a descriptive title. The top diagrams are separated from the bottom diagrams by a dashed horizontal line. The top-right diagram includes the text "Counterfactual" along one of the edges.
### Detailed Analysis or Content Details
**Diagram (a) - αNLI:**
* Nodes: O1 (light orange), Hi (light green), O2 (light orange).
* Edges: O1 -> Hi, Hi -> O2.
* This diagram represents a sequential relationship between observations and a hypothesis.
**Diagram (b) - Counterfactual Reasoning from TimeTravel:**
* Nodes: S1 (light orange), S2 (light green), S3 (light orange), S2' (light green), S3' (light orange).
* Edges: S1 -> S2, S1 -> S2', S2 -> S3, S2' -> S3'.
* The edge between S1 and S2' is labeled "Counterfactual".
* This diagram illustrates branching possibilities, representing a counterfactual scenario.
**Diagram (c) - Branching Hypotheses (Top-Left of Bottom Section):**
* Nodes: O1 (light orange), H1 (light green), O2 (light orange).
* Edges: O1 -> H1, H1 -> O2.
* This diagram represents a sequential relationship between observations and a hypothesis.
**Diagram (d) - Branching Hypotheses (Top-Right of Bottom Section):**
* Nodes: O1 (light orange), H2 (light green), H1 (light green), O2 (light orange), H2 (light green), O2 (yellow).
* Edges: O1 -> H1, O1 -> H2, H1 -> O2, H2 -> O2.
* This diagram represents branching hypotheses originating from a single observation.
### Key Observations
* The diagrams utilize a consistent visual language of nodes and edges.
* The color coding appears to represent different types of entities (observations, hypotheses).
* Diagram (b) explicitly introduces the concept of "Counterfactual" reasoning.
* The bottom diagrams demonstrate a more complex branching structure compared to the top diagrams.
* The bottom diagrams have a dashed line connecting O2 and O2.
### Interpretation
These diagrams likely represent different approaches to reasoning within a computational or philosophical framework.
* **αNLI (Diagram a)** represents a simple inference process where an observation (O1) leads to a hypothesis (Hi), which in turn leads to another observation (O2). This is a straightforward chain of reasoning.
* **Counterfactual Reasoning (Diagram b)** introduces the idea of alternative realities or "what if" scenarios. Starting from a state (S1), two possible paths are explored: a factual path (S2 -> S3) and a counterfactual path (S2' -> S3'). This is crucial for understanding causality and making decisions.
* **Branching Hypotheses (Diagrams c & d)** illustrate how multiple hypotheses can be generated from a single observation. Diagram (d) shows how these hypotheses can lead to different observations, highlighting the importance of considering multiple possibilities.
The use of color coding suggests that observations are represented by orange nodes, hypotheses by green nodes, and potentially outcomes or results by yellow nodes. The dashed line in the bottom diagrams might indicate a relationship or connection between the different branches of reasoning.
These diagrams are likely used to illustrate the underlying logic of different reasoning systems or to compare and contrast their capabilities. They provide a visual representation of complex concepts, making them easier to understand and analyze. The diagrams are not presenting data, but rather a conceptual framework.