## Multiple Line Charts: Network Analysis
### Overview
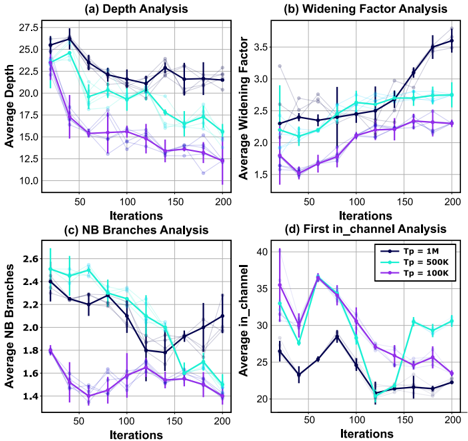
The image presents four line charts analyzing different network properties across iterations. The charts are arranged in a 2x2 grid. Each chart displays the average value of a specific network property (Depth, Widening Factor, Number of Branches, and First in_channel) as a function of iterations, with data series for three different parameter settings (Tp = 1M, Tp = 500K, and Tp = 100K). Error bars are included on each data point.
### Components/Axes
* **Overall Structure:** Four line charts arranged in a 2x2 grid. Each chart has the same x-axis ("Iterations") but different y-axes representing different network properties.
* **X-Axis (Iterations):** Shared across all four charts.
* Label: "Iterations"
* Scale: 0 to 200, with tick marks at approximately 50, 100, 150, and 200.
* **Y-Axes:**
* **(a) Depth Analysis:**
* Label: "Average Depth"
* Scale: Approximately 10 to 27.5, with tick marks at 12.5, 15.0, 17.5, 20.0, 22.5, 25.0, and 27.5.
* **(b) Widening Factor Analysis:**
* Label: "Average Widening Factor"
* Scale: Approximately 1.5 to 3.5, with tick marks at 1.5, 2.0, 2.5, 3.0, and 3.5.
* **(c) NB Branches Analysis:**
* Label: "Average NB Branches"
* Scale: Approximately 1.4 to 2.6, with tick marks at 1.4, 1.6, 1.8, 2.0, 2.2, 2.4, and 2.6.
* **(d) First in_channel Analysis:**
* Label: "Average in_channel"
* Scale: Approximately 20 to 40, with tick marks at 20, 25, 30, 35, and 40.
* **Legends (Chart d, bottom-right):**
* Located in the top-right of the fourth chart (d).
* Tp = 1M (Black line)
* Tp = 500K (Teal line)
* Tp = 100K (Purple line)
### Detailed Analysis
#### (a) Depth Analysis
* **Tp = 1M (Black):** Starts at approximately 26.5, decreases to around 22 by iteration 50, and then remains relatively stable around 22 with slight fluctuations.
* **Tp = 500K (Teal):** Starts at approximately 25, decreases to around 17.5 by iteration 50, and then remains relatively stable around 17.5 with slight fluctuations.
* **Tp = 100K (Purple):** Starts at approximately 23, decreases to around 15 by iteration 50, and then remains relatively stable around 15 with slight fluctuations.
#### (b) Widening Factor Analysis
* **Tp = 1M (Black):** Starts at approximately 2.3, remains relatively stable until iteration 100, and then increases to approximately 3.5 by iteration 200.
* **Tp = 500K (Teal):** Starts at approximately 2.6, remains relatively stable around 2.5 with slight fluctuations.
* **Tp = 100K (Purple):** Starts at approximately 1.5, increases slightly to around 2 by iteration 50, and then remains relatively stable around 2 with slight fluctuations.
#### (c) NB Branches Analysis
* **Tp = 1M (Black):** Starts at approximately 2.5, decreases to around 2.1 by iteration 50, and then remains relatively stable around 2.1 with slight fluctuations.
* **Tp = 500K (Teal):** Starts at approximately 2.5, decreases to around 2.1 by iteration 50, and then remains relatively stable around 2.1 with slight fluctuations.
* **Tp = 100K (Purple):** Starts at approximately 1.6, decreases to around 1.5 by iteration 50, and then remains relatively stable around 1.5 with slight fluctuations.
#### (d) First in_channel Analysis
* **Tp = 1M (Black):** Starts at approximately 25, increases to approximately 30 by iteration 50, then decreases to approximately 21 by iteration 150, and remains stable.
* **Tp = 500K (Teal):** Starts at approximately 40, decreases to approximately 22 by iteration 150, and remains stable.
* **Tp = 100K (Purple):** Starts at approximately 35, decreases to approximately 25 by iteration 150, and remains stable.
### Key Observations
* **Depth (a):** All three parameter settings show a decrease in average depth during the initial iterations, followed by stabilization. Higher Tp values result in higher average depth.
* **Widening Factor (b):** Tp = 1M shows a significant increase in the widening factor after iteration 100, while Tp = 500K and Tp = 100K remain relatively stable.
* **NB Branches (c):** All three parameter settings show a decrease in the average number of branches during the initial iterations, followed by stabilization. Higher Tp values result in a higher average number of branches.
* **First in_channel (d):** All three parameter settings show a decrease in the average first in_channel during the initial iterations, followed by stabilization.
### Interpretation
The charts illustrate the impact of different parameter settings (Tp values) on various network properties during the training process. The initial decrease in depth and number of branches suggests an initial phase of network simplification or pruning. The widening factor analysis indicates that a higher Tp value (Tp = 1M) leads to a significant increase in the network's width after a certain number of iterations, while lower Tp values maintain a more stable width. The "First in_channel" analysis shows that higher Tp values initially lead to higher average values, but all settings converge to similar levels after a number of iterations. The error bars indicate the variability in the data, providing a measure of confidence in the observed trends.