## Line Charts: Performance Metrics Analysis
### Overview
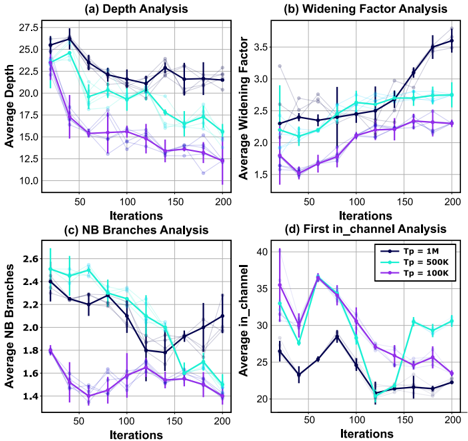
The image presents a 2x2 grid of line charts illustrating the performance metrics of a system across 200 iterations. The four charts analyze different parameters: (a) Depth, (b) Widening Factor, (c) NB Branches, and (d) First in_channel. Each chart compares three configurations defined by the parameter $T_p$: $1M$ (Dark Blue), $500K$ (Cyan), and $100K$ (Purple).
### Components/Axes
* **Common X-Axis:** "Iterations" ranging from 20 to 200, with increments of 50.
* **Legend (Located in the top-right of chart 'd'):**
* **Dark Blue line:** $T_p = 1M$
* **Cyan line:** $T_p = 500K$
* **Purple line:** $T_p = 100K$
* **Chart (a) "Depth Analysis":** Y-axis "Average Depth" (10.0 to 27.5).
* **Chart (b) "Widening Factor Analysis":** Y-axis "Average Widening Factor" (1.5 to 3.5).
* **Chart (c) "NB Branches Analysis":** Y-axis "Average NB Branches" (1.4 to 2.6).
* **Chart (d) "First in_channel Analysis":** Y-axis "Average in_channel" (20 to 40).
---
### Detailed Analysis
#### (a) Depth Analysis
* **Trends:** All three series show a general downward trend after an initial phase.
* **Dark Blue ($1M$):** Starts at ~25.5, peaks at iteration 40 (~26.2), then trends downward, stabilizing around 21.5.
* **Cyan ($500K$):** Starts at ~23.5, peaks at iteration 40 (~24.5), then declines steadily to ~15.5.
* **Purple ($100K$):** Starts at ~23, drops sharply to ~17 by iteration 40, then continues a gradual decline to ~12.
#### (b) Widening Factor Analysis
* **Trends:** All three series show an upward trend as iterations increase.
* **Dark Blue ($1M$):** Starts at ~2.3, rises steadily, with a steeper increase after iteration 100, ending at ~3.6.
* **Cyan ($500K$):** Starts at ~2.2, rises gradually to ~2.7.
* **Purple ($100K$):** Starts at ~1.8, rises to ~2.3.
#### (c) NB Branches Analysis
* **Trends:** All series show a downward trend.
* **Dark Blue ($1M$):** Starts at ~2.4, trends downward to ~1.8 (at iteration 140), then recovers slightly to ~2.1.
* **Cyan ($500K$):** Starts at ~2.5, trends downward consistently to ~1.5.
* **Purple ($100K$):** Starts at ~1.8, drops to ~1.4, and remains low throughout.
#### (d) First in_channel Analysis
* **Trends:** Highly volatile across all series.
* **Dark Blue ($1M$):** Starts at ~26, dips to ~23, peaks at ~28 (iteration 80), drops to ~21, and ends at ~22.
* **Cyan ($500K$):** Starts at ~33, dips to ~28, peaks at ~36 (iteration 80), drops to ~20, and rises to ~30.
* **Purple ($100K$):** Starts at ~40, drops to ~30, peaks at ~36 (iteration 80), then drops significantly to ~23.
---
### Key Observations
* **Parameter Sensitivity:** The $T_p$ parameter has a clear, monotonic impact on Depth and Widening Factor: higher $T_p$ values ($1M$) consistently yield higher Depth and Widening Factor values, while lower $T_p$ values ($100K$) yield lower values.
* **Volatility:** Chart (d) "First in_channel" exhibits the highest volatility and non-linear behavior compared to the other metrics, which show smoother, more predictable trends.
* **Convergence/Divergence:** In Chart (b), the gap between the $1M$ configuration and the others widens significantly after iteration 100, suggesting that the $1M$ configuration scales differently as iterations progress.
### Interpretation
The data demonstrates that the $T_p$ parameter acts as a scaling factor for the structural complexity of the system. Higher $T_p$ values ($1M$) appear to promote deeper and wider structures (Charts a and b). Conversely, the "NB Branches" metric (Chart c) suggests that lower $T_p$ values lead to a reduction in branching complexity. The "First in_channel" analysis (Chart d) suggests that this specific metric is highly sensitive to the initial state and iteration count, showing a "sawtooth" pattern that indicates the system may be undergoing periodic re-adjustments or phase shifts during the training or iteration process. The error bars indicate that while the trends are distinct, there is significant variance within each configuration, particularly in the early iterations.