## Multi-Panel Line Chart: Iterative Analysis of Neural Network Metrics
### Overview
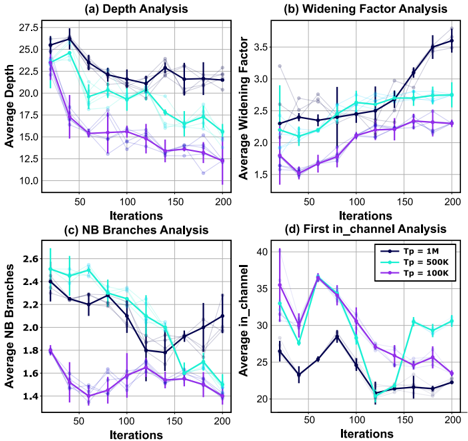
The image displays a 2x2 grid of four line charts, each analyzing a different metric over 200 iterations. The charts share a common x-axis ("Iterations") and a common legend, which is placed within the bottom-right chart (d). Each chart plots three data series corresponding to different values of a parameter labeled "Tp".
### Components/Axes
* **Common X-Axis (All Charts):** "Iterations", with major tick marks at 0, 50, 100, 150, and 200.
* **Common Legend (Located in chart d, bottom-right):**
* **Black Line:** `Tp = 1M`
* **Cyan Line:** `Tp = 500K`
* **Purple Line:** `Tp = 100K`
* **Chart (a) - Top Left:**
* **Title:** "(a) Depth Analysis"
* **Y-Axis Label:** "Average Depth"
* **Y-Axis Scale:** 10.0 to 27.5, with increments of 2.5.
* **Chart (b) - Top Right:**
* **Title:** "(b) Widening Factor Analysis"
* **Y-Axis Label:** "Average Widening Factor"
* **Y-Axis Scale:** 1.5 to 3.5, with increments of 0.5.
* **Chart (c) - Bottom Left:**
* **Title:** "(c) NB Branches Analysis"
* **Y-Axis Label:** "Average NB Branches"
* **Y-Axis Scale:** 1.4 to 2.6, with increments of 0.2.
* **Chart (d) - Bottom Right:**
* **Title:** "(d) First in_channel Analysis"
* **Y-Axis Label:** "Average in_channel"
* **Y-Axis Scale:** 20 to 40, with increments of 5.
### Detailed Analysis
**Chart (a): Depth Analysis**
* **Trend Verification:** The black line (`Tp=1M`) shows a general downward trend with some fluctuations. The cyan line (`Tp=500K`) peaks early (~50 iterations) before declining. The purple line (`Tp=100K`) shows a steady, steep decline.
* **Approximate Data Points (Average Depth):**
* **Iteration 0:** Black ~26.5, Cyan ~24.0, Purple ~23.0
* **Iteration 50:** Black ~24.5, Cyan ~25.0 (peak), Purple ~17.5
* **Iteration 100:** Black ~22.0, Cyan ~20.0, Purple ~15.0
* **Iteration 150:** Black ~22.5, Cyan ~17.5, Purple ~14.0
* **Iteration 200:** Black ~21.5, Cyan ~17.0, Purple ~12.5
**Chart (b): Widening Factor Analysis**
* **Trend Verification:** The black line (`Tp=1M`) shows a consistent upward trend. The cyan line (`Tp=500K`) fluctuates but ends higher than it started. The purple line (`Tp=100K`) is relatively flat with a slight upward trend.
* **Approximate Data Points (Average Widening Factor):**
* **Iteration 0:** Black ~2.3, Cyan ~2.2, Purple ~1.7
* **Iteration 50:** Black ~2.4, Cyan ~2.1, Purple ~1.6
* **Iteration 100:** Black ~2.5, Cyan ~2.5, Purple ~2.1
* **Iteration 150:** Black ~2.7, Cyan ~2.6, Purple ~2.2
* **Iteration 200:** Black ~3.6 (sharp increase), Cyan ~2.8, Purple ~2.3
**Chart (c): NB Branches Analysis**
* **Trend Verification:** All three lines show a general downward trend over the 200 iterations. The black line (`Tp=1M`) has a notable uptick at the very end.
* **Approximate Data Points (Average NB Branches):**
* **Iteration 0:** Black ~2.4, Cyan ~2.6, Purple ~1.8
* **Iteration 50:** Black ~2.2, Cyan ~2.5, Purple ~1.5
* **Iteration 100:** Black ~2.0, Cyan ~2.2, Purple ~1.6
* **Iteration 150:** Black ~1.8, Cyan ~1.9, Purple ~1.5
* **Iteration 200:** Black ~2.1 (uptick), Cyan ~1.5, Purple ~1.4
**Chart (d): First in_channel Analysis**
* **Trend Verification:** The lines are more volatile. The cyan line (`Tp=500K`) shows a large peak around iteration 150. The black line (`Tp=1M`) has a dip around iteration 120. The purple line (`Tp=100K`) trends downward.
* **Approximate Data Points (Average in_channel):**
* **Iteration 0:** Black ~28, Cyan ~35, Purple ~37
* **Iteration 50:** Black ~24, Cyan ~30, Purple ~33
* **Iteration 100:** Black ~28, Cyan ~25, Purple ~27
* **Iteration 150:** Black ~22, Cyan ~30, Purple ~25
* **Iteration 200:** Black ~23, Cyan ~30, Purple ~23
### Key Observations
1. **Consistent Parameter Effect:** Across all metrics, the `Tp=1M` (black) configuration generally maintains higher values for Depth and Widening Factor but lower values for NB Branches compared to the `Tp=100K` (purple) configuration.
2. **Divergent Widening:** The most dramatic change is in the Widening Factor for `Tp=1M`, which spikes sharply after iteration 150, suggesting a significant architectural shift late in the process.
3. **Volatility in Channel Count:** The "First in_channel" metric is the most volatile for all configurations, with no single clear trend, indicating this parameter is highly sensitive to the iterative process.
4. **Inverse Relationship:** There appears to be an inverse relationship between "Average Depth" and "Average Widening Factor" over time, particularly for the `Tp=1M` and `Tp=500K` series. As depth decreases, the widening factor tends to increase.
### Interpretation
This set of charts likely visualizes the evolution of a neural network's architecture during an iterative training or pruning process, where "Tp" could represent a total parameter count, a pruning threshold, or a similar hyperparameter.
The data suggests a trade-off: processes with a higher `Tp` value (1M) tend to create deeper networks initially but then actively reduce depth while increasing the "widening factor" (likely the number of channels or neurons per layer). This could indicate a shift from deep, narrow structures to shallower, wider ones. The concurrent decrease in "NB Branches" (number of branches) for all configurations suggests the network is becoming less complex or more streamlined over iterations.
The high volatility in the "First in_channel" metric implies that the initial layer's configuration is unstable and frequently adjusted, possibly as the network searches for an optimal starting feature representation. The sharp late-stage increase in widening for `Tp=1M` is a critical anomaly; it may represent a final optimization phase where the network expands its capacity in a key layer after settling on an overall depth and branch structure.