## Chart/Diagram Type: Multi-subplot Analysis of Algorithm Performance Metrics
### Overview
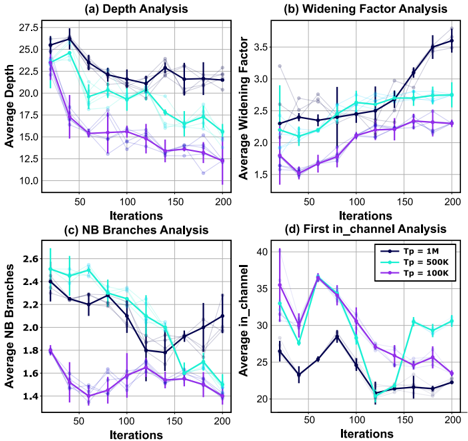
The image contains four subplots (a-d) analyzing algorithm performance across iterations for different population sizes (Tp=1M, 500K, 100K). Each subplot tracks a distinct metric: depth, widening factor, NB branches, and first-in channel values. Data is presented as line graphs with error bars, showing trends over 200 iterations.
### Components/Axes
- **Subplot (a) Depth Analysis**
- **X-axis**: Iterations (50, 100, 150, 200)
- **Y-axis**: Average Depth (10–27.5)
- **Legend**:
- Black: Tp=1M
- Cyan: Tp=500K
- Purple: Tp=100K
- **Subplot (b) Widening Factor Analysis**
- **X-axis**: Iterations (50, 100, 150, 200)
- **Y-axis**: Average Widening Factor (1.5–3.5)
- **Legend**: Same as (a)
- **Subplot (c) NB Branches Analysis**
- **X-axis**: Iterations (50, 100, 150, 200)
- **Y-axis**: Average NB Branches (1.4–2.6)
- **Legend**: Same as (a)
- **Subplot (d) First In Channel Analysis**
- **X-axis**: Iterations (50, 100, 150, 200)
- **Y-axis**: Average First In Channel (20–40)
- **Legend**: Same as (a)
### Detailed Analysis
#### (a) Depth Analysis
- **Tp=1M (Black)**: Starts at ~25, drops to ~20 by 100 iterations, stabilizes near 22.
- **Tp=500K (Cyan)**: Starts at ~20, fluctuates, rises to ~22 by 200 iterations.
- **Tp=100K (Purple)**: Starts at ~15, fluctuates, drops to ~12 by 200 iterations.
#### (b) Widening Factor Analysis
- **Tp=1M (Black)**: Starts at ~1.5, increases steadily to ~3.0.
- **Tp=500K (Cyan)**: Starts at ~2.0, fluctuates, decreases to ~1.8 by 200 iterations.
- **Tp=100K (Purple)**: Starts at ~1.5, fluctuates, increases to ~2.5 by 200 iterations.
#### (c) NB Branches Analysis
- **Tp=1M (Black)**: Starts at ~2.6, decreases to ~2.0 by 100 iterations, stabilizes near 2.2.
- **Tp=500K (Cyan)**: Starts at ~2.4, fluctuates, rises to ~2.2 by 200 iterations.
- **Tp=100K (Purple)**: Starts at ~1.8, fluctuates, drops to ~1.4 by 200 iterations.
#### (d) First In Channel Analysis
- **Tp=1M (Black)**: Starts at ~35, drops sharply to ~20 by 100 iterations, fluctuates between 20–25.
- **Tp=500K (Cyan)**: Starts at ~30, fluctuates, decreases to ~22 by 200 iterations.
- **Tp=100K (Purple)**: Starts at ~25, fluctuates, increases to ~28 by 200 iterations.
### Key Observations
1. **Tp=1M (Black)** consistently shows higher average depth and widening factor but fewer NB branches, suggesting deeper but less exploratory behavior.
2. **Tp=100K (Purple)** exhibits the most fluctuation across metrics, indicating instability in performance.
3. **First In Channel** values for Tp=1M drop significantly after 100 iterations, implying improved channel selection efficiency over time.
4. Error bars suggest higher variability in Tp=100K compared to larger populations.
### Interpretation
The data suggests that larger population sizes (Tp=1M) prioritize depth and widening factor, likely due to broader exploration. Smaller populations (Tp=100K) show erratic behavior, possibly due to limited diversity. The decline in NB branches with larger Tp indicates reduced branching, aligning with focused exploration. The First In Channel metric for Tp=1M demonstrates adaptive improvement, hinting at optimized resource allocation in later iterations. These trends highlight trade-offs between exploration (widening factor) and exploitation (depth) in algorithmic performance.