## Line Chart: Effective Dimension vs. log₁₀(2m+1)
### Overview
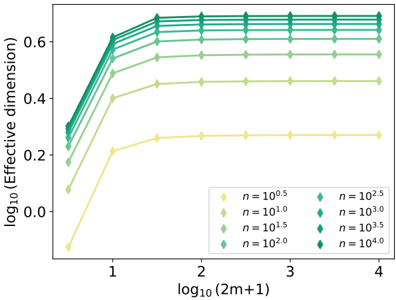
The chart illustrates the relationship between the effective dimension (log₁₀ scale) and the parameter `log₁₀(2m+1)` for varying values of `n` (ranging from 10⁰.⁵ to 10⁴.⁰). Multiple lines represent different `n` values, showing how the effective dimension evolves as `log₁₀(2m+1)` increases.
### Components/Axes
- **X-axis**: `log₁₀(2m+1)` (logarithmic scale, values: 1, 2, 3, 4).
- **Y-axis**: `log₁₀(Effective dimension)` (logarithmic scale, values: 0.0 to 0.6).
- **Legend**: Located in the bottom-right corner, mapping colors to `n` values:
- Yellow: `n = 10⁰.⁵`
- Light green: `n = 10¹.⁰`
- Medium green: `n = 10¹.⁵`
- Dark green: `n = 10².⁰`
- Teal: `n = 10³.⁰`
- Dark teal: `n = 10³.⁵`
- Darkest teal: `n = 10⁴.⁰`
### Detailed Analysis
1. **Line Trends**:
- **`n = 10⁰.⁵` (Yellow)**: Starts at the lowest y-value (~0.1) and rises sharply to plateau near 0.3 by `log₁₀(2m+1) = 2`.
- **`n = 10¹.⁰` (Light green)**: Begins higher (~0.2) and plateaus near 0.45 by `log₁₀(2m+1) = 2`.
- **`n = 10¹.⁵` (Medium green)**: Starts at ~0.3 and plateaus near 0.55 by `log₁₀(2m+1) = 2`.
- **`n = 10².⁰` (Dark green)**: Begins at ~0.4 and plateaus near 0.6 by `log₁₀(2m+1) = 2`.
- **Higher `n` values (Teal/Dark teal/Darkest teal)**: All plateau near 0.6 by `log₁₀(2m+1) = 2`, with minimal further growth beyond this point.
2. **Data Points**:
- At `log₁₀(2m+1) = 1`:
- `n = 10⁰.⁵`: ~0.1
- `n = 10¹.⁰`: ~0.2
- `n = 10¹.⁵`: ~0.3
- `n = 10².⁰`: ~0.4
- At `log₁₀(2m+1) = 4`:
- All lines plateau near 0.6, with negligible differences between `n = 10³.⁰`, `n = 10³.⁵`, and `n = 10⁴.⁰`.
### Key Observations
- **Saturation Effect**: For `log₁₀(2m+1) ≥ 2`, the effective dimension stabilizes across all `n` values, suggesting diminishing returns for larger `n`.
- **Positive Correlation**: Higher `n` values consistently yield higher effective dimensions, but the gap narrows as `n` increases.
- **Logarithmic Scaling**: The logarithmic axes emphasize multiplicative relationships, making exponential growth patterns more interpretable.
### Interpretation
The chart demonstrates that the effective dimension increases with `n` but reaches a saturation threshold (around `log₁₀(2m+1) = 2`). This implies that beyond a certain point, increasing `n` does not significantly enhance the effective dimension, potentially indicating a system with inherent limitations or constraints. The logarithmic scaling highlights the efficiency of scaling laws, where exponential increases in `n` yield only linear improvements in the effective dimension. This could inform optimization strategies in fields like machine learning or network theory, where resource allocation must balance diminishing returns.