## Bar Chart: Metric Mean Scores
### Overview
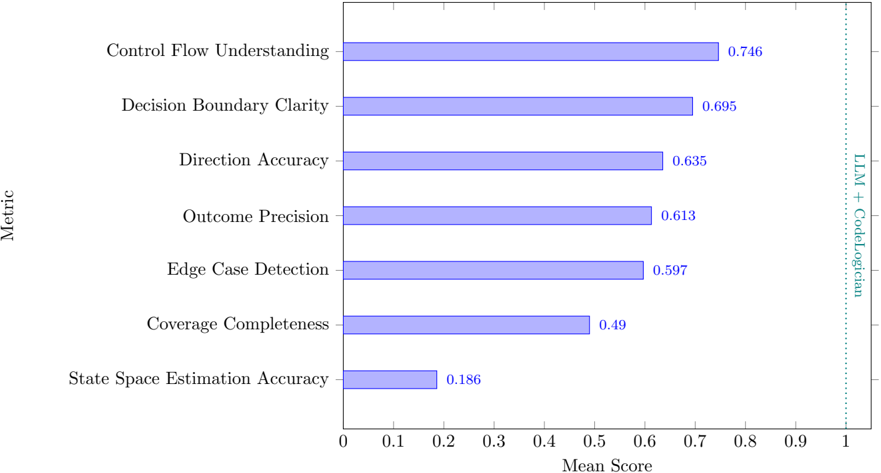
The image is a horizontal bar chart comparing the mean scores of different metrics. The metrics are listed on the vertical axis, and the mean scores are displayed on the horizontal axis. A vertical dotted line indicates the performance of "LLM + CodeLogician".
### Components/Axes
* **Vertical Axis (Metric):** Lists the different metrics being evaluated.
* Control Flow Understanding
* Decision Boundary Clarity
* Direction Accuracy
* Outcome Precision
* Edge Case Detection
* Coverage Completeness
* State Space Estimation Accuracy
* **Horizontal Axis (Mean Score):** Represents the mean score, ranging from 0 to 1, with increments of 0.1.
* **Bars:** Horizontal bars represent the mean score for each metric. The bars are light blue.
* **Vertical Dotted Line:** A vertical dotted line at x=1, labeled "LLM + CodeLogician". The line is green.
### Detailed Analysis
The following are the mean scores for each metric, extracted from the bar chart:
* **Control Flow Understanding:** 0.746
* **Decision Boundary Clarity:** 0.695
* **Direction Accuracy:** 0.635
* **Outcome Precision:** 0.613
* **Edge Case Detection:** 0.597
* **Coverage Completeness:** 0.49
* **State Space Estimation Accuracy:** 0.186
The bars are arranged in descending order of mean score, except for "Coverage Completeness" and "State Space Estimation Accuracy".
### Key Observations
* "Control Flow Understanding" has the highest mean score (0.746), while "State Space Estimation Accuracy" has the lowest (0.186).
* The mean scores generally decrease as you move down the chart, with a significant drop for "State Space Estimation Accuracy".
* The "LLM + CodeLogician" line is at the maximum score of 1.
### Interpretation
The bar chart provides a comparison of the performance of different metrics. The high score for "Control Flow Understanding" suggests that the system performs well in this area. The low score for "State Space Estimation Accuracy" indicates a potential area for improvement. The "LLM + CodeLogician" line at 1.0 suggests that this combined approach achieves perfect performance, at least according to the scale of this chart. The chart highlights the relative strengths and weaknesses of the system across different evaluation metrics.