## Horizontal Bar Chart: Evaluation Metrics for "LLM + CodeLogician"
### Overview
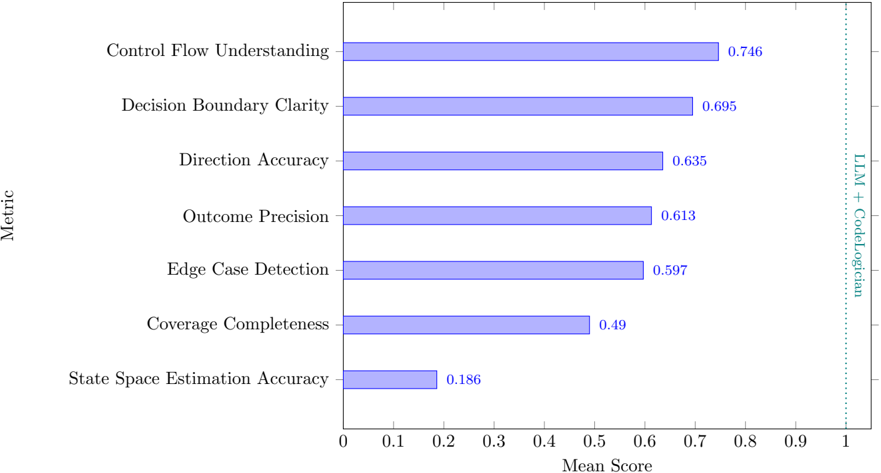
The image displays a horizontal bar chart presenting the mean scores for seven distinct evaluation metrics. The chart is oriented with metrics listed vertically on the y-axis and their corresponding mean scores on the x-axis, which ranges from 0 to 1. A vertical label on the right side identifies the evaluated system as "LLM + CodeLogician."
### Components/Axes
* **Y-Axis (Vertical):** Labeled "Metric." It lists seven categorical metrics from top to bottom.
* **X-Axis (Horizontal):** Labeled "Mean Score." It has a linear scale with major tick marks at intervals of 0.1, from 0 to 1.
* **Data Series:** A single series represented by horizontal bars, all colored in a uniform light blue/periwinkle shade.
* **Legend:** Located on the far right, vertically aligned. It consists of the text "LLM + CodeLogician" written vertically, indicating the subject of the evaluation. The text color is a teal/green shade.
* **Data Labels:** Each bar has its precise numerical mean score displayed at its end.
### Detailed Analysis
The metrics are presented in descending order of their mean score. The exact values are as follows:
1. **Control Flow Understanding:** Score = 0.746. This is the highest-performing metric.
2. **Decision Boundary Clarity:** Score = 0.695.
3. **Direction Accuracy:** Score = 0.635.
4. **Outcome Precision:** Score = 0.613.
5. **Edge Case Detection:** Score = 0.597.
6. **Coverage Completeness:** Score = 0.49.
7. **State Space Estimation Accuracy:** Score = 0.186. This is the lowest-performing metric by a significant margin.
**Trend Verification:** The visual trend is a clear, monotonic decrease in bar length from the top metric to the bottom metric. There are no increases or plateaus; each subsequent bar is shorter than the one above it.
### Key Observations
* **Performance Gradient:** There is a substantial performance gap between the top metric (Control Flow Understanding at 0.746) and the bottom metric (State Space Estimation Accuracy at 0.186), a difference of 0.56 points.
* **Clustering:** The middle five metrics (Decision Boundary Clarity through Edge Case Detection) form a cluster with scores ranging from approximately 0.60 to 0.70.
* **Significant Outlier:** "State Space Estimation Accuracy" is a clear outlier, performing dramatically worse than all other metrics. Its score is less than half that of the next lowest metric (Coverage Completeness at 0.49).
* **Threshold Crossing:** Only one metric ("Control Flow Understanding") achieves a score above 0.7. Five metrics score above 0.5, while one ("State Space Estimation Accuracy") scores well below 0.2.
### Interpretation
The data suggests that the "LLM + CodeLogician" system exhibits a specific and uneven performance profile across different evaluation dimensions.
* **Strengths:** The system demonstrates its strongest capabilities in understanding program logic and structure, as evidenced by high scores in **Control Flow Understanding** and **Decision Boundary Clarity**. This indicates proficiency in parsing and reasoning about the sequential and conditional logic within code.
* **Moderate Capabilities:** It shows moderate, consistent performance in tasks related to accuracy and precision of outputs (**Direction Accuracy, Outcome Precision**) and in identifying non-standard scenarios (**Edge Case Detection**).
* **Key Weakness:** The system has a critical and pronounced weakness in **State Space Estimation Accuracy**. This metric likely pertains to the system's ability to model or predict the full range of possible states a program or system can enter. The very low score (0.186) suggests a fundamental limitation in this area, which could impact reliability in complex, stateful applications.
* **Overall Implication:** The evaluation paints a picture of a tool that is adept at static analysis and understanding declared logic but struggles significantly with dynamic analysis and modeling runtime behavior. The stark contrast between its high scores in structural understanding and its very low score in state estimation is the most critical finding, highlighting a specific area for targeted improvement. The system appears more reliable for tasks involving code comprehension and verification of explicit logic than for tasks requiring deep simulation or prediction of system behavior over time.