## Horizontal Bar Chart: LLM + CodeLogician Performance Metrics
### Overview
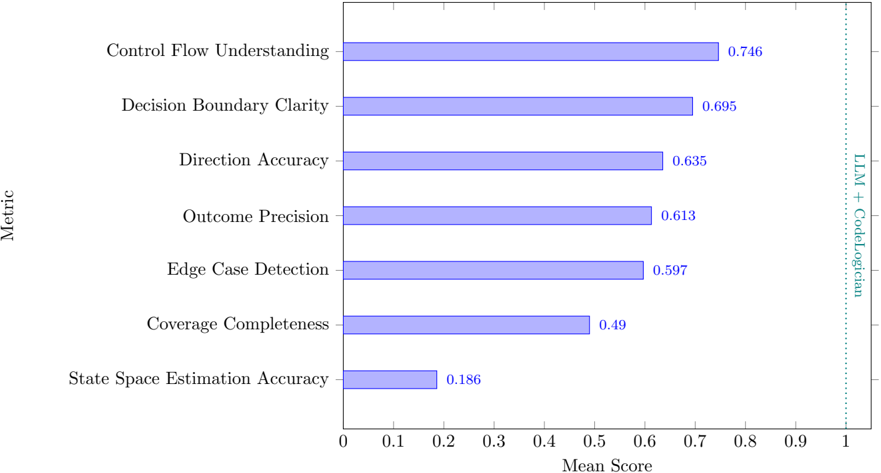
The chart compares seven technical metrics related to code understanding and generation, measured by mean scores between 0 and 1. A vertical dotted line at 0.8 serves as a benchmark reference labeled "LLM + CodeLogician". All metrics fall below this threshold, with scores ranging from 0.186 to 0.746.
### Components/Axes
- **Y-Axis (Metric)**: Lists seven evaluation criteria in descending order of performance:
1. Control Flow Understanding
2. Decision Boundary Clarity
3. Direction Accuracy
4. Outcome Precision
5. Edge Case Detection
6. Coverage Completeness
7. State Space Estimation Accuracy
- **X-Axis (Mean Score)**: Numerical scale from 0 to 1, with a vertical reference line at 0.8.
- **Legend**: Positioned on the right side, uses blue bars to represent all data series (no explicit legend labels provided in the image).
### Detailed Analysis
- **Control Flow Understanding**: Highest score at 0.746, closest to the 0.8 benchmark.
- **Decision Boundary Clarity**: 0.695, second-highest performance.
- **Direction Accuracy**: 0.635, third-highest.
- **Outcome Precision**: 0.613, fourth-highest.
- **Edge Case Detection**: 0.597, fifth-highest.
- **Coverage Completeness**: 0.49, sixth-highest.
- **State Space Estimation Accuracy**: Lowest score at 0.186, significantly below all others.
### Key Observations
1. **Performance Gradient**: Scores decrease progressively from top to bottom, with a steep drop between Edge Case Detection (0.597) and Coverage Completeness (0.49).
2. **Benchmark Gap**: No metric reaches the 0.8 "LLM + CodeLogician" threshold, though Control Flow Understanding (0.746) comes closest.
3. **Outlier**: State Space Estimation Accuracy (0.186) is an extreme outlier, performing 75% worse than the next-lowest metric (Coverage Completeness at 0.49).
### Interpretation
The data suggests that while the system demonstrates strong performance in understanding code structure (Control Flow Understanding) and logical decision-making (Decision Boundary Clarity), it struggles significantly with state space estimation—a critical component for complex code reasoning. The consistent underperformance relative to the 0.8 benchmark indicates room for improvement across all metrics, with particular emphasis needed on state space modeling. The gradual decline in scores from top to bottom metrics may reflect increasing complexity in the evaluated tasks, suggesting that simpler code understanding tasks are handled better than more abstract or comprehensive reasoning challenges.