## Scatter Plot: Model Performance Across Datasets
### Overview
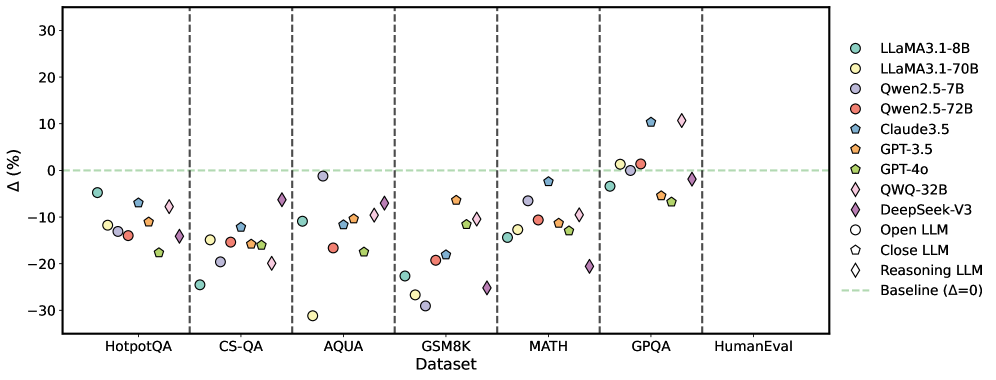
The image is a scatter plot comparing the performance of various Large Language Models (LLMs) across different datasets. The y-axis represents the percentage difference (Δ (%)) from a baseline, and the x-axis represents the datasets. Each LLM is represented by a unique color and marker.
### Components/Axes
* **X-Axis:** "Dataset" with categories: HotpotQA, CS-QA, AQUA, GSM8K, MATH, GPQA, HumanEval. Vertical dashed lines separate each dataset.
* **Y-Axis:** "Δ (%)" ranging from -30 to 30, with tick marks at -30, -20, -10, 0, 10, 20, and 30.
* **Legend (Top-Right):**
* Light Blue Circle: LLaMA3.1-8B
* Yellow Circle: LLaMA3.1-70B
* Light Purple Circle: Qwen2.5-7B
* Red Circle: Qwen2.5-72B
* Dark Blue Pentagon: Claude3.5
* Orange Pentagon: GPT-3.5
* Green Pentagon: GPT-4o
* Yellow Diamond: QWQ-32B
* Dark Purple Diamond: DeepSeek-V3
* White Circle: Open LLM
* White Pentagon: Close LLM
* White Diamond: Reasoning LLM
* Light Green Dashed Line: Baseline (Δ=0)
* **Baseline:** A horizontal dashed light green line at Δ (%) = 0.
### Detailed Analysis
Here's a breakdown of the approximate performance of each model on each dataset:
* **HotpotQA:**
* LLaMA3.1-8B (Light Blue Circle): Approximately -5%
* LLaMA3.1-70B (Yellow Circle): Approximately -12%
* Qwen2.5-7B (Light Purple Circle): Approximately -13%
* Qwen2.5-72B (Red Circle): Approximately -14%
* Claude3.5 (Dark Blue Pentagon): Approximately -7%
* GPT-3.5 (Orange Pentagon): Approximately -10%
* GPT-4o (Green Pentagon): Approximately -17%
* QWQ-32B (Yellow Diamond): Approximately -8%
* DeepSeek-V3 (Dark Purple Diamond): Approximately -12%
* Open LLM (White Circle): Approximately -14%
* Close LLM (White Pentagon): Approximately -12%
* Reasoning LLM (White Diamond): Approximately -10%
* **CS-QA:**
* LLaMA3.1-8B (Light Blue Circle): Approximately -23%
* LLaMA3.1-70B (Yellow Circle): Approximately -19%
* Qwen2.5-7B (Light Purple Circle): Approximately -12%
* Qwen2.5-72B (Red Circle): Approximately -15%
* Claude3.5 (Dark Blue Pentagon): Approximately -12%
* GPT-3.5 (Orange Pentagon): Approximately -15%
* GPT-4o (Green Pentagon): Approximately -15%
* QWQ-32B (Yellow Diamond): Approximately -20%
* DeepSeek-V3 (Dark Purple Diamond): Approximately -12%
* Open LLM (White Circle): Approximately -19%
* Close LLM (White Pentagon): Approximately -15%
* Reasoning LLM (White Diamond): Approximately -15%
* **AQUA:**
* LLaMA3.1-8B (Light Blue Circle): Approximately -22%
* LLaMA3.1-70B (Yellow Circle): Approximately -27%
* Qwen2.5-7B (Light Purple Circle): Approximately -6%
* Qwen2.5-72B (Red Circle): Approximately -17%
* Claude3.5 (Dark Blue Pentagon): Approximately -18%
* GPT-3.5 (Orange Pentagon): Approximately -6%
* GPT-4o (Green Pentagon): Approximately -10%
* QWQ-32B (Yellow Diamond): Approximately -8%
* DeepSeek-V3 (Dark Purple Diamond): Approximately -6%
* Open LLM (White Circle): Approximately -22%
* Close LLM (White Pentagon): Approximately -27%
* Reasoning LLM (White Diamond): Approximately -10%
* **GSM8K:**
* LLaMA3.1-8B (Light Blue Circle): Approximately -23%
* LLaMA3.1-70B (Yellow Circle): Approximately -28%
* Qwen2.5-7B (Light Purple Circle): Approximately -14%
* Qwen2.5-72B (Red Circle): Approximately -17%
* Claude3.5 (Dark Blue Pentagon): Approximately -18%
* GPT-3.5 (Orange Pentagon): Approximately -10%
* GPT-4o (Green Pentagon): Approximately -10%
* QWQ-32B (Yellow Diamond): Approximately -10%
* DeepSeek-V3 (Dark Purple Diamond): Approximately -14%
* Open LLM (White Circle): Approximately -20%
* Close LLM (White Pentagon): Approximately -28%
* Reasoning LLM (White Diamond): Approximately -10%
* **MATH:**
* LLaMA3.1-8B (Light Blue Circle): Approximately -10%
* LLaMA3.1-70B (Yellow Circle): Approximately -10%
* Qwen2.5-7B (Light Purple Circle): Approximately -5%
* Qwen2.5-72B (Red Circle): Approximately -1%
* Claude3.5 (Dark Blue Pentagon): Approximately -1%
* GPT-3.5 (Orange Pentagon): Approximately -5%
* GPT-4o (Green Pentagon): Approximately -10%
* QWQ-32B (Yellow Diamond): Approximately -8%
* DeepSeek-V3 (Dark Purple Diamond): Approximately -5%
* Open LLM (White Circle): Approximately -10%
* Close LLM (White Pentagon): Approximately -10%
* Reasoning LLM (White Diamond): Approximately -5%
* **GPQA:**
* LLaMA3.1-8B (Light Blue Circle): Approximately 0%
* LLaMA3.1-70B (Yellow Circle): Approximately -5%
* Qwen2.5-7B (Light Purple Circle): Approximately 10%
* Qwen2.5-72B (Red Circle): Approximately 10%
* Claude3.5 (Dark Blue Pentagon): Approximately 11%
* GPT-3.5 (Orange Pentagon): Approximately 1%
* GPT-4o (Green Pentagon): Approximately -5%
* QWQ-32B (Yellow Diamond): Approximately 12%
* DeepSeek-V3 (Dark Purple Diamond): Approximately 1%
* Open LLM (White Circle): Approximately 0%
* Close LLM (White Pentagon): Approximately -5%
* Reasoning LLM (White Diamond): Approximately 1%
* **HumanEval:**
* LLaMA3.1-8B (Light Blue Circle): Approximately -10%
* LLaMA3.1-70B (Yellow Circle): Approximately -10%
* Qwen2.5-7B (Light Purple Circle): Approximately -10%
* Qwen2.5-72B (Red Circle): Approximately -15%
* Claude3.5 (Dark Blue Pentagon): Approximately -12%
* GPT-3.5 (Orange Pentagon): Approximately -15%
* GPT-4o (Green Pentagon): Approximately -15%
* QWQ-32B (Yellow Diamond): Approximately -2%
* DeepSeek-V3 (Dark Purple Diamond): Approximately -10%
* Open LLM (White Circle): Approximately -10%
* Close LLM (White Pentagon): Approximately -10%
* Reasoning LLM (White Diamond): Approximately -2%
### Key Observations
* Most models perform below the baseline (Δ=0) on the HotpotQA, CS-QA, AQUA, GSM8K, and MATH datasets.
* The performance varies significantly across different datasets for all models.
* QWQ-32B, Claude3.5, Qwen2.5-7B, and Qwen2.5-72B tend to perform relatively better on GPQA.
* QWQ-32B and Reasoning LLM perform relatively better on HumanEval.
### Interpretation
The scatter plot provides a comparative analysis of the performance of various LLMs on different question-answering and reasoning datasets. The negative Δ (%) values indicate that most models underperform relative to the baseline on several datasets. The variability in performance across datasets suggests that different models have varying strengths and weaknesses depending on the type of task or knowledge required. The better performance of some models on GPQA and HumanEval indicates that these models might be better suited for tasks requiring general problem-solving abilities or human-like evaluation skills. The plot highlights the importance of evaluating LLMs on a diverse set of benchmarks to understand their capabilities and limitations.