## Scatter Plot: Performance Comparison of LLMs Across Datasets
### Overview
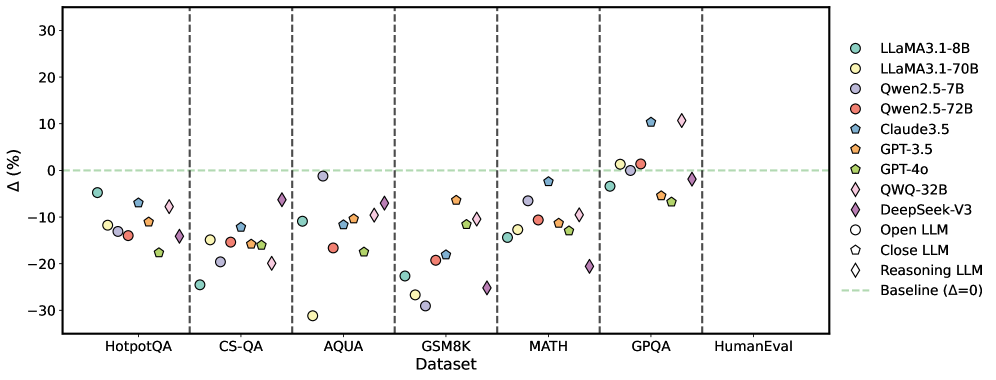
The image presents a scatter plot comparing the performance of various Large Language Models (LLMs) across seven different datasets. The y-axis represents the performance difference (Δ) in percentage points, while the x-axis lists the datasets. Each point on the plot represents the performance of a specific LLM on a given dataset, relative to a baseline.
### Components/Axes
* **X-axis:** "Dataset" with the following categories: HotpotQA, CS-QA, AQUA, GSM8K, MATH, GPQA, HumanEval.
* **Y-axis:** "Δ (%)" (Delta in percentage), ranging from approximately -30% to 30%.
* **Legend:** Located in the top-right corner, identifying each LLM with a unique color and marker shape. The legend includes:
* LLaMA3.1-8B (Light Blue Circle)
* LLaMA3.1-70B (Dark Blue Circle)
* Qwen2.5-7B (Light Red Circle)
* Qwen2.5-72B (Dark Red Circle)
* Claude3.5 (Light Green Diamond)
* GPT-3.5 (Dark Green Triangle)
* GPT-4o (Light Purple Diamond)
* QWQ-32B (Dark Purple Diamond)
* DeepSeek-V3 (Magenta Diamond)
* Open LLM (Grey Circle)
* Close LLM (Grey Hexagon)
* Reasoning LLM (Grey Diamond)
* **Baseline:** A dashed horizontal line at Δ=0, representing the baseline performance.
### Detailed Analysis
The plot shows the performance variation of each LLM across the datasets. Here's a breakdown of the approximate values, noting the inherent uncertainty in reading values from a visual plot:
* **HotpotQA:**
* LLaMA3.1-8B: ~-5%
* LLaMA3.1-70B: ~-10%
* Qwen2.5-7B: ~-10%
* Qwen2.5-72B: ~-15%
* Claude3.5: ~0%
* GPT-3.5: ~-5%
* GPT-4o: ~5%
* QWQ-32B: ~-5%
* DeepSeek-V3: ~-10%
* Open LLM: ~-5%
* Close LLM: ~-10%
* Reasoning LLM: ~0%
* **CS-QA:**
* LLaMA3.1-8B: ~-10%
* LLaMA3.1-70B: ~-15%
* Qwen2.5-7B: ~-10%
* Qwen2.5-72B: ~-15%
* Claude3.5: ~-5%
* GPT-3.5: ~-10%
* GPT-4o: ~5%
* QWQ-32B: ~-5%
* DeepSeek-V3: ~-10%
* Open LLM: ~-10%
* Close LLM: ~-15%
* Reasoning LLM: ~0%
* **AQUA:**
* LLaMA3.1-8B: ~-10%
* LLaMA3.1-70B: ~-10%
* Qwen2.5-7B: ~-10%
* Qwen2.5-72B: ~-15%
* Claude3.5: ~0%
* GPT-3.5: ~-5%
* GPT-4o: ~10%
* QWQ-32B: ~-5%
* DeepSeek-V3: ~-10%
* Open LLM: ~-10%
* Close LLM: ~-15%
* Reasoning LLM: ~0%
* **GSM8K:**
* LLaMA3.1-8B: ~-20%
* LLaMA3.1-70B: ~-20%
* Qwen2.5-7B: ~-20%
* Qwen2.5-72B: ~-25%
* Claude3.5: ~-10%
* GPT-3.5: ~-15%
* GPT-4o: ~0%
* QWQ-32B: ~-10%
* DeepSeek-V3: ~-15%
* Open LLM: ~-20%
* Close LLM: ~-25%
* Reasoning LLM: ~-5%
* **MATH:**
* LLaMA3.1-8B: ~-25%
* LLaMA3.1-70B: ~-25%
* Qwen2.5-7B: ~-20%
* Qwen2.5-72B: ~-25%
* Claude3.5: ~-10%
* GPT-3.5: ~-20%
* GPT-4o: ~0%
* QWQ-32B: ~-10%
* DeepSeek-V3: ~-15%
* Open LLM: ~-25%
* Close LLM: ~-25%
* Reasoning LLM: ~-5%
* **GPQA:**
* LLaMA3.1-8B: ~0%
* LLaMA3.1-70B: ~0%
* Qwen2.5-7B: ~-5%
* Qwen2.5-72B: ~-10%
* Claude3.5: ~10%
* GPT-3.5: ~0%
* GPT-4o: ~5%
* QWQ-32B: ~0%
* DeepSeek-V3: ~-5%
* Open LLM: ~0%
* Close LLM: ~-5%
* Reasoning LLM: ~5%
* **HumanEval:**
* LLaMA3.1-8B: ~-10%
* LLaMA3.1-70B: ~-10%
* Qwen2.5-7B: ~-10%
* Qwen2.5-72B: ~-15%
* Claude3.5: ~0%
* GPT-3.5: ~-5%
* GPT-4o: ~5%
* QWQ-32B: ~-5%
* DeepSeek-V3: ~-10%
* Open LLM: ~-10%
* Close LLM: ~-15%
* Reasoning LLM: ~0%
### Key Observations
* GPT-4o consistently outperforms other models across most datasets, often showing positive Δ values.
* LLaMA3.1-8B and LLaMA3.1-70B show similar performance across all datasets.
* Qwen2.5-7B and Qwen2.5-72B also exhibit similar performance, generally lower than GPT-4o.
* The GSM8K and MATH datasets consistently show the lowest performance for most LLMs.
* The GPQA dataset shows the most variability in performance, with some models achieving positive Δ values.
### Interpretation
The data suggests that GPT-4o is the most robust and versatile LLM among those tested, demonstrating superior performance across a wide range of tasks and datasets. The consistent underperformance on GSM8K and MATH indicates these datasets pose a significant challenge for current LLMs, likely due to their complexity and reliance on mathematical reasoning. The relatively similar performance of the two LLaMA3.1 models and the two Qwen2.5 models suggests that increasing model size within these architectures does not necessarily translate to substantial performance gains. The grouping of "Open LLM", "Close LLM", and "Reasoning LLM" suggests a categorization based on model architecture or training methodology, and their performance is generally lower than the leading models like GPT-4o and Claude3.5. The scatter plot effectively visualizes the trade-offs between different LLMs and highlights the areas where further research and development are needed. The baseline (Δ=0) provides a crucial reference point for evaluating the relative performance of each model.