## Scatter Plot: Model Performance Comparison Across Datasets
### Overview
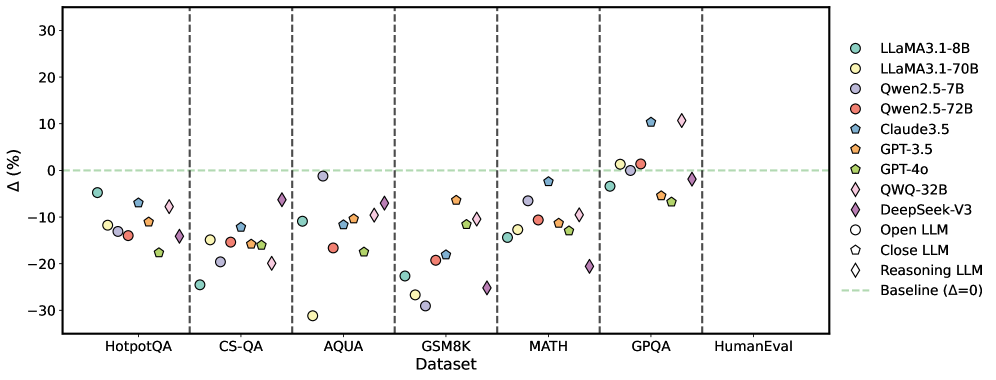
The image is a scatter plot comparing the performance change (Δ%) of various large language models (LLMs) across multiple question-answering and reasoning datasets. The plot includes 10 datasets on the x-axis and percentage change on the y-axis, with a baseline line at Δ=0%. Different models are represented by distinct colors and markers.
### Components/Axes
- **X-axis (Datasets)**:
- HotpotQA, CS-QA, AQUA, GSM8K, MATH, GPQA, HumanEval
- Dashed vertical lines separate datasets
- **Y-axis (Δ%)**:
- Range: -30% to 30%
- Baseline line at 0% (green dashed)
- **Legend**:
- Position: Right side
- Models:
- LLaMA3.1-8B (teal circle)
- LLaMA3.1-70B (yellow circle)
- Qwen2.5-7B (purple circle)
- Qwen2.5-72B (red circle)
- Claude3.5 (blue pentagon)
- GPT-3.5 (orange pentagon)
- GPT-4o (green pentagon)
- QWQ-32B (pink diamond)
- DeepSeek-V3 (purple diamond)
- Open LLM (white circle)
- Close LLM (blue pentagon)
- Reasoning LLM (purple diamond)
- Baseline (Δ=0): Green dashed line
### Detailed Analysis
1. **HotpotQA**:
- LLaMA3.1-8B: ~-15%
- DeepSeek-V3: ~-25%
- GPT-4o: ~-18%
- QWQ-32B: ~-12%
2. **CS-QA**:
- LLaMA3.1-70B: ~-10%
- Qwen2.5-72B: ~-15%
- GPT-3.5: ~-5%
- Reasoning LLM: ~-20%
3. **AQUA**:
- LLaMA3.1-8B: ~-10%
- Qwen2.5-7B: ~-5%
- GPT-4o: ~-12%
- DeepSeek-V3: ~-18%
4. **GSM8K**:
- LLaMA3.1-70B: ~-20%
- Qwen2.5-72B: ~-10%
- GPT-3.5: ~-15%
- Reasoning LLM: ~-25%
5. **MATH**:
- LLaMA3.1-8B: ~-5%
- Qwen2.5-7B: ~-10%
- GPT-4o: ~-8%
- DeepSeek-V3: ~-12%
6. **GPQA**:
- LLaMA3.1-70B: ~5%
- Qwen2.5-72B: ~3%
- GPT-4o: ~-2%
- DeepSeek-V3: ~10%
7. **HumanEval**:
- LLaMA3.1-8B: ~-2%
- Qwen2.5-7B: ~-5%
- GPT-4o: ~-3%
- DeepSeek-V3: ~8%
### Key Observations
- **DeepSeek-V3** consistently shows the largest negative deviations (e.g., -25% in HotpotQA, -25% in GSM8K).
- **LLaMA3.1-70B** and **GPT-4o** generally cluster near the baseline (Δ≈0%) across most datasets.
- **QWQ-32B** and **DeepSeek-V3** exhibit significant variability, with some datasets showing extreme negative performance (e.g., -20% in GSM8K for QWQ-32B).
- **HumanEval** shows the smallest deviations overall, with most models within ±10% of baseline.
### Interpretation
The data suggests significant variability in LLM performance across different question types and reasoning tasks. Models like **DeepSeek-V3** and **QWQ-32B** underperform in complex reasoning tasks (GSM8K, MATH), while **LLaMA3.1-70B** and **GPT-4o** demonstrate more consistent performance. The baseline line (Δ=0%) serves as a critical reference point, revealing that many models struggle to match human-level performance in specialized domains. Notably, **HumanEval** shows the least deviation, implying better alignment with human evaluation metrics compared to other datasets. The plot highlights the need for model specialization in specific reasoning domains, as no single model dominates across all tasks.