## Timeline Chart: Evolution of Memory Technologies (2000–2020)
### Overview
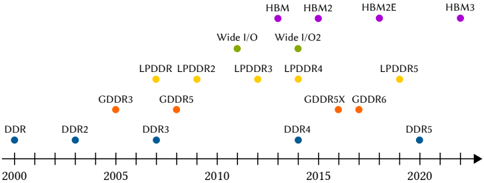
The image is a horizontal timeline chart illustrating the introduction years of various memory technology standards from approximately 2000 to 2020. The chart uses colored dots to represent different memory families, plotted against a linear time axis. The primary purpose is to show the chronological progression and generational overlap of these technologies.
### Components/Axes
* **X-Axis (Horizontal):** A timeline labeled with years. Major tick marks and labels are present for 2000, 2005, 2010, 2015, and 2020. Minor tick marks appear to represent individual years between these major labels.
* **Y-Axis (Vertical):** There is no explicit labeled Y-axis. Instead, different memory technology families are grouped vertically by color, creating implicit rows or categories.
* **Legend:** Located at the top center of the chart. It consists of colored dots paired with text labels, defining the memory families:
* **Blue Dot:** DDR
* **Orange Dot:** GDDR
* **Yellow Dot:** LPDDR
* **Green Dot:** Wide I/O
* **Purple Dot:** HBM
* **Data Points:** Colored dots are placed on the timeline to indicate the approximate introduction year of each specific technology standard.
### Detailed Analysis
The chart plots the following memory technologies, grouped by family (color) and ordered chronologically from left to right:
**1. DDR Family (Blue Dots):**
* **DDR:** Positioned at the year 2000.
* **DDR2:** Positioned approximately at 2003.
* **DDR3:** Positioned approximately at 2007.
* **DDR4:** Positioned approximately at 2014.
* **DDR5:** Positioned approximately at 2020.
**2. GDDR Family (Orange Dots):**
* **GDDR3:** Positioned approximately at 2004.
* **GDDR5:** Positioned approximately at 2008.
* **GDDR5X:** Positioned approximately at 2016.
* **GDDR6:** Positioned approximately at 2018.
**3. LPDDR Family (Yellow Dots):**
* **LPDDR:** Positioned approximately at 2006.
* **LPDDR2:** Positioned approximately at 2009.
* **LPDDR3:** Positioned approximately at 2012.
* **LPDDR4:** Positioned approximately at 2014.
* **LPDDR5:** Positioned approximately at 2019.
**4. Wide I/O Family (Green Dots):**
* **Wide I/O:** Positioned approximately at 2011.
* **Wide I/O2:** Positioned approximately at 2014.
**5. HBM Family (Purple Dots):**
* **HBM:** Positioned approximately at 2013.
* **HBM2:** Positioned approximately at 2016.
* **HBM2E:** Positioned approximately at 2018.
* **HBM3:** Positioned approximately at 2020.
### Key Observations
* **Technological Overlap:** Multiple generations of different memory types coexist. For example, around 2014, DDR4, LPDDR4, and Wide I/O2 were all introduced.
* **Pace of Innovation:** The LPDDR family shows a relatively consistent generational update cycle of roughly 2-3 years. The HBM family shows rapid iteration from 2013 to 2020.
* **Market Segmentation:** The vertical separation by color clearly distinguishes memory types designed for different markets: standard system memory (DDR), graphics (GDDR), mobile/low-power (LPDDR), and high-bandwidth specialized memory (Wide I/O, HBM).
* **Recent Convergence (2020):** The timeline shows both DDR5 and HBM3 appearing around the same time (2020), indicating advancements in both mainstream and high-end memory interfaces.
### Interpretation
This chart visually narrates the parallel evolution of memory technologies driven by diverging market needs. The **DDR** line represents the steady, foundational progress of main system memory. The **GDDR** and **HBM** lines illustrate the relentless pursuit of higher bandwidth for graphics and compute-intensive applications, with HBM representing a more advanced, 3D-stacked approach. The **LPDDR** line highlights the critical importance of power efficiency for mobile devices, with its own rapid development cycle. The **Wide I/O** family appears as a shorter-lived attempt to address mobile bandwidth needs through a different interface.
The chart demonstrates that memory development is not a single linear path but a branching tree of specializations. The overlapping timelines show that new standards do not immediately replace old ones; instead, they coexist and serve different segments of the computing ecosystem for many years. The clustering of introductions around 2014 and 2020 may correlate with broader industry shifts, such as the rise of smartphones, data centers, and AI accelerators, which demand diverse memory solutions.