## Diagram: Dimensional Transformation of Bit Arrays
### Overview
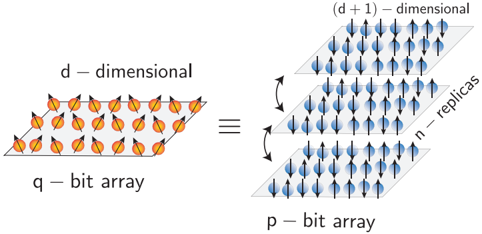
The image is a technical diagram illustrating a conceptual equivalence or transformation between two types of bit arrays. It visually represents a process where a lower-dimensional array of "q-bits" is transformed into a higher-dimensional array of "p-bits" through a replication process. The diagram is composed of two primary sections connected by an equals sign (`≡`), indicating a relationship of equivalence or definitional transformation.
### Components/Axes
The diagram is divided into two main regions:
1. **Left Region (Input/Source):**
* **Visual Element:** A single, two-dimensional grid plane.
* **Content:** The grid is populated with orange arrows. Each arrow points in one of several distinct directions (not just up/down), suggesting a continuous or multi-state variable.
* **Labels:**
* Above the grid: `d – dimensional`
* Below the grid: `q – bit array`
2. **Central Connector:**
* **Symbol:** An equals sign (`≡`), positioned centrally between the left and right regions. This denotes that the left-hand side is equivalent to, or can be transformed into, the right-hand side.
3. **Right Region (Output/Result):**
* **Visual Element:** Three identical two-dimensional grid planes stacked vertically, creating a three-dimensional structure.
* **Content:** Each grid is populated with blue arrows. Each arrow points either directly up or directly down, representing a binary state.
* **Labels:**
* Above the top grid: `(d + 1) – dimensional`
* Below the bottom grid: `p – bit array`
* To the right of the stack, with a double-headed arrow spanning the height of the three grids: `n – replicas`
### Detailed Analysis
* **Spatial Grounding & Color Coding:**
* The **orange arrows** are confined to the single, left-hand grid labeled "q-bit array."
* The **blue arrows** are confined to the three stacked grids on the right, labeled "p-bit array."
* The label `n – replicas` is positioned to the right of the stack, with its arrow explicitly indicating that the three grids are copies (replicas) of each other.
* **Component Isolation & Trend Verification:**
* **Left Side (d-dimensional):** The visual trend is one of **diversity in orientation**. The arrows point in various diagonal directions, indicating that each "q-bit" can hold a value from a continuous range or a set of multiple discrete states.
* **Right Side ((d+1)-dimensional):** The visual trend is one of **binary uniformity and replication**. Each arrow is strictly vertical (up or down). The structure is replicated `n` times along a new dimension, increasing the overall dimensionality from `d` to `d+1`.
* **Transformation Logic:** The diagram proposes that a `d`-dimensional array of multi-state "q-bits" can be represented as a `(d+1)`-dimensional array of binary "p-bits." The extra dimension (`d+1`) is used to create `n` replicas of the original data structure, where each complex state from the q-bit array is now encoded in the binary state of a corresponding p-bit across the replicas.
### Key Observations
1. **State Simplification:** There is a clear transition from a complex, multi-directional state representation (orange arrows) to a simple, binary state representation (blue arrows).
2. **Dimensional Increase:** The transformation explicitly increases the dimensionality of the system by one (`d` to `d+1`).
3. **Replication as Encoding:** The mechanism for this transformation is replication (`n-replicas`). The information from the original array is not lost but is redistributed across multiple binary copies in a higher-dimensional space.
4. **Symbolic Equivalence:** The use of `≡` suggests this is a formal equivalence or a definitional mapping in a theoretical model, likely from fields like quantum computing, information theory, or statistical mechanics.
### Interpretation
This diagram visually formalizes a theoretical concept where a system with continuous or multi-valued degrees of freedom (q-bits) can be mapped onto a system with purely binary degrees of freedom (p-bits) by introducing an additional dimension of replication.
* **What it suggests:** It demonstrates a method for **discretization and redundancy**. The complex state of a single q-bit is encoded into the collective binary state of `n` p-bit replicas. This could be a model for error correction, measurement, or a theoretical construct to analyze complex systems using simpler binary components.
* **How elements relate:** The left side is the "problem" or original system. The equals sign is the "transformation rule." The right side is the "solution" or equivalent representation. The `n-replicas` label is the key operational parameter of the transformation.
* **Notable Anomaly/Insight:** The most significant insight is the trade-off presented: to achieve binary simplicity (p-bits), one must accept increased dimensionality and redundancy (replicas). This is a common theme in theoretical physics and computer science, where complex phenomena are often modeled by combining many simple, identical components. The diagram elegantly captures this trade-off between state complexity and structural complexity.