## Heatmap: Shorter Inferences
### Overview
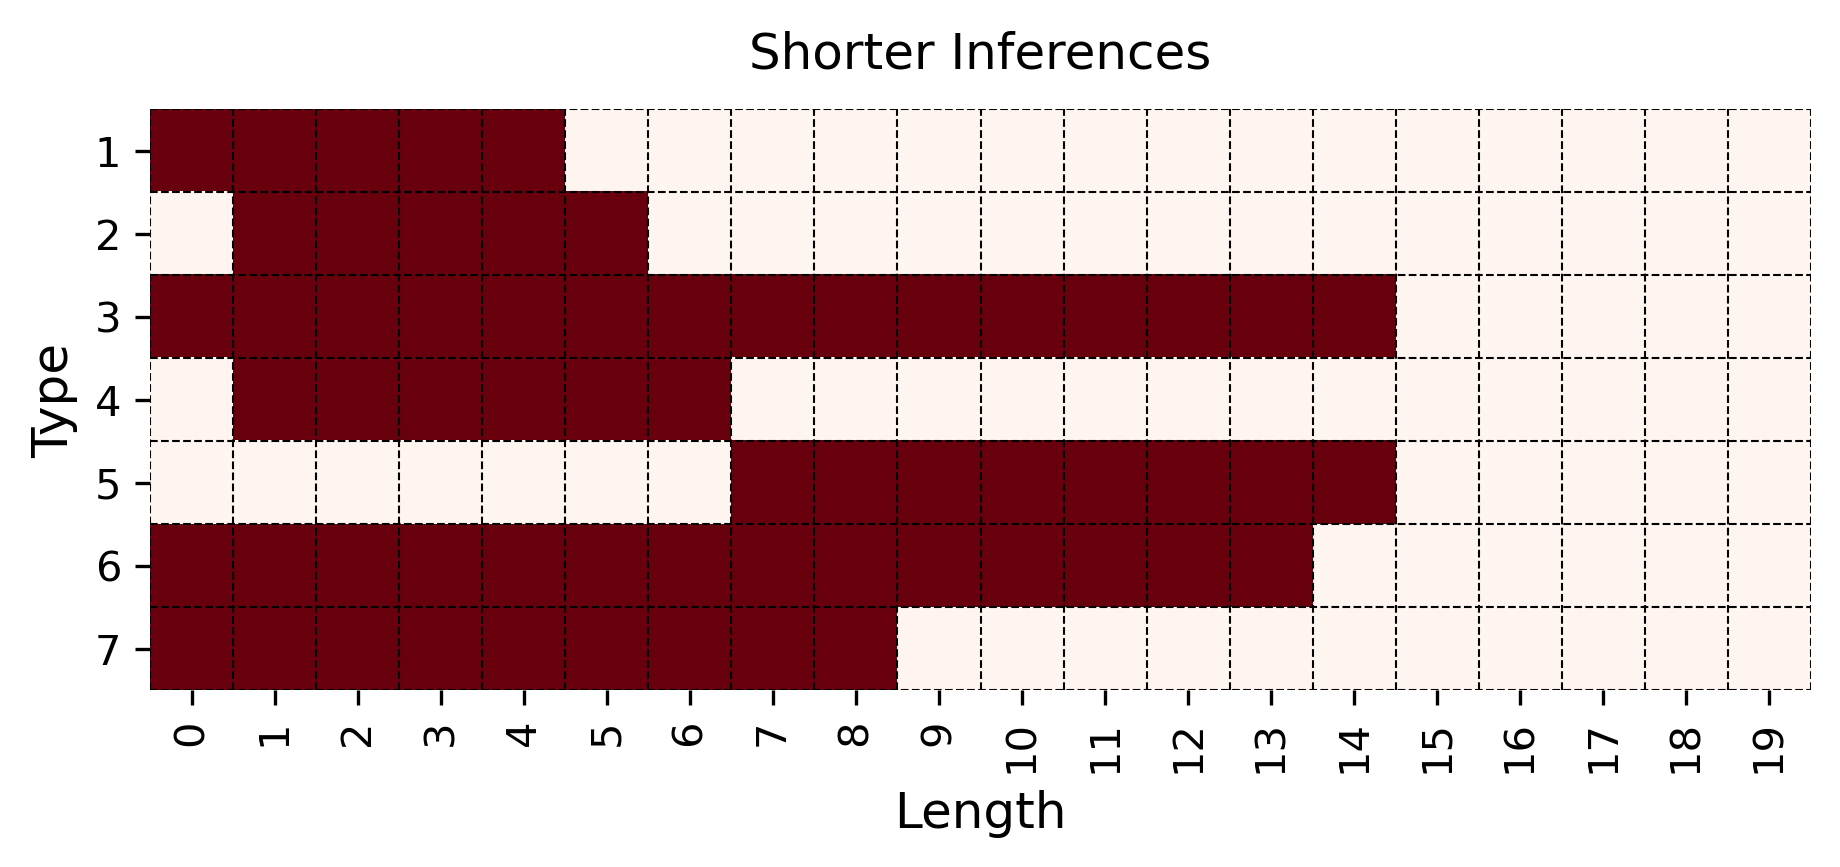
The image is a heatmap titled "Shorter Inferences". The heatmap visualizes the relationship between "Type" (ranging from 1 to 7) and "Length" (ranging from 0 to 19). The cells are colored either in a dark red or a light beige, indicating the presence or absence of a relationship between the type and length.
### Components/Axes
* **Title:** Shorter Inferences
* **Y-axis:**
* Label: Type
* Scale: 1, 2, 3, 4, 5, 6, 7
* **X-axis:**
* Label: Length
* Scale: 0, 1, 2, 3, 4, 5, 6, 7, 8, 9, 10, 11, 12, 13, 14, 15, 16, 17, 18, 19
* **Colors:**
* Dark Red: Indicates a relationship or presence.
* Light Beige: Indicates no relationship or absence.
### Detailed Analysis
The heatmap shows which lengths are associated with each type.
* **Type 1:** Dark red from length 0 to 4.
* **Type 2:** Dark red from length 1 to 6.
* **Type 3:** Dark red from length 0 to 14.
* **Type 4:** Dark red from length 0 to 7.
* **Type 5:** Dark red from length 8 to 14.
* **Type 6:** Dark red from length 0 to 14.
* **Type 7:** Dark red from length 0 to 9.
### Key Observations
* Types 3 and 6 have the longest continuous stretches of dark red, indicating they are associated with a wider range of lengths.
* Type 5 has a gap before its dark red stretch, starting at length 8.
* Types 1 and 2 have the shortest stretches of dark red.
### Interpretation
The heatmap visualizes the distribution of lengths for different types of inferences. The dark red cells indicate the lengths that are more commonly associated with each type. The data suggests that some types of inferences (e.g., Type 3 and Type 6) tend to have a broader range of lengths, while others (e.g., Type 1 and Type 2) are more restricted to shorter lengths. Type 5 is unique in that it only appears for lengths 8-14, suggesting it represents a specific category of inferences with intermediate length. The heatmap provides a concise overview of the relationship between inference type and length.