\n
## Heatmap: Shorter Inferences
### Overview
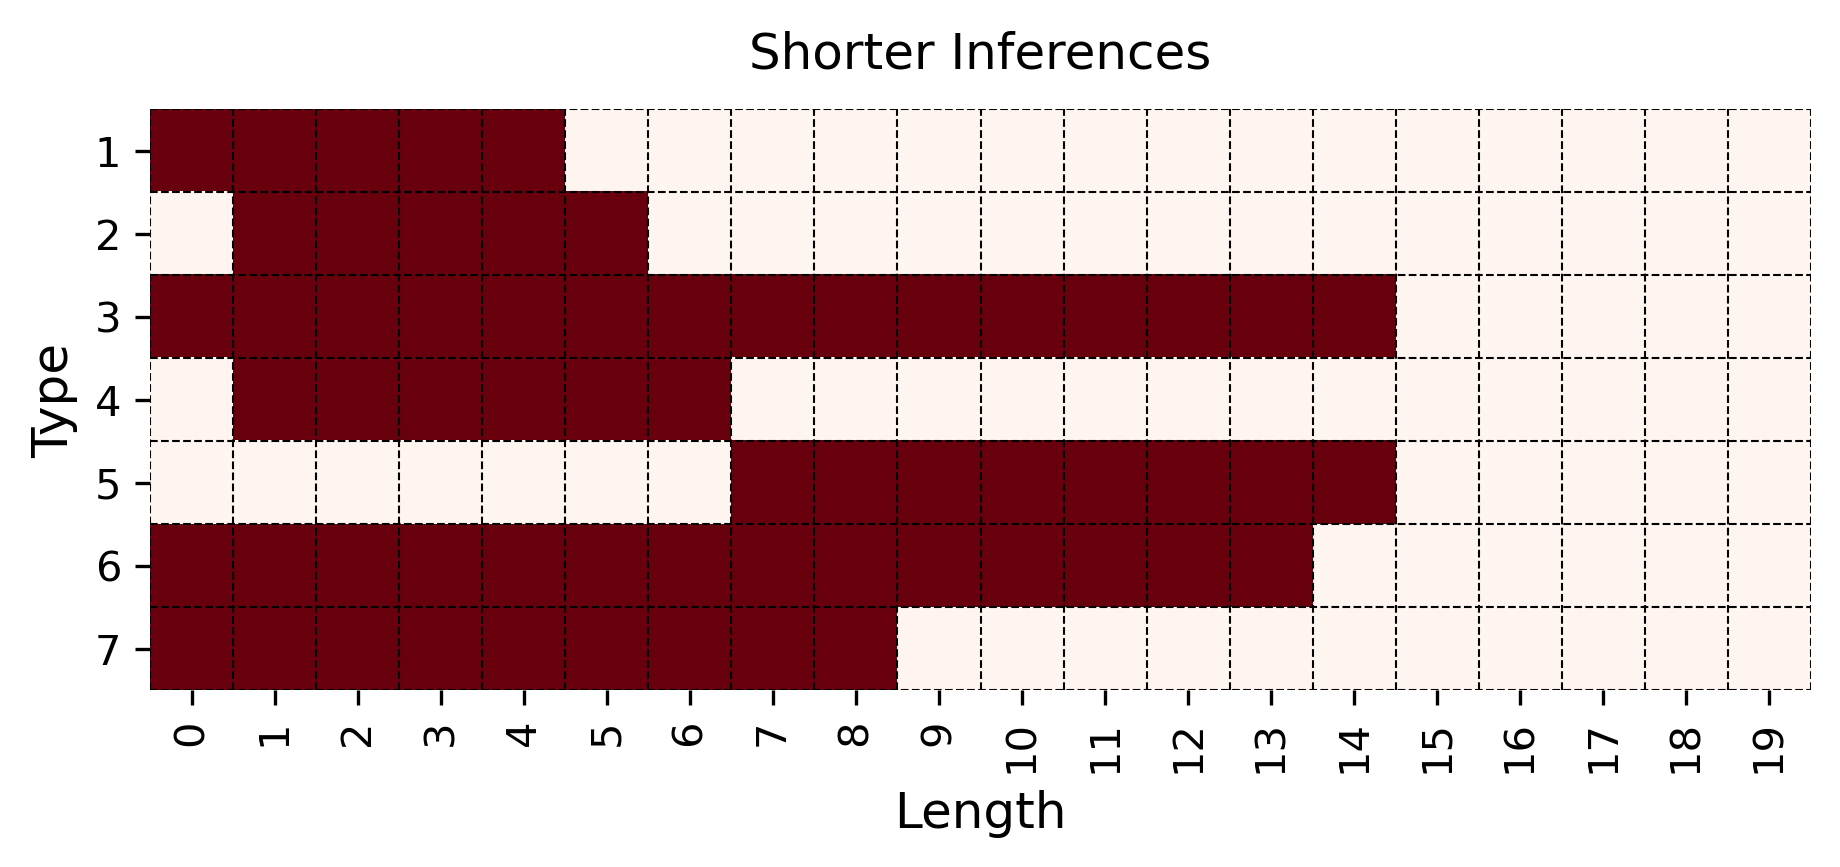
The image presents a heatmap visualizing the relationship between "Length" and "Type". The heatmap uses a red color to indicate presence or a higher value, and white indicates absence or a lower value. The grid is structured with "Length" on the horizontal axis and "Type" on the vertical axis.
### Components/Axes
* **Title:** "Shorter Inferences" - positioned at the top-center of the image.
* **X-axis Label:** "Length" - positioned at the bottom-center of the image. The axis is marked with integer values from 0 to 19, incrementing by 1.
* **Y-axis Label:** "Type" - positioned at the center-left of the image. The axis is marked with integer values from 1 to 7, incrementing by 1.
* **Color Legend:** Implicitly, red indicates presence/higher value, and white indicates absence/lower value.
### Detailed Analysis
The heatmap shows the distribution of "Type" across different "Length" values. Each cell represents the intersection of a specific "Type" and "Length". A red cell indicates a value, while a white cell indicates no value.
Here's a breakdown of the data, reading row by row (Type 1 to Type 7):
* **Type 1:** Red cells from Length 0 to Length 5. Approximately 6 cells are red.
* **Type 2:** Red cells from Length 0 to Length 6. Approximately 7 cells are red.
* **Type 3:** Red cells from Length 0 to Length 7, and Length 13 to Length 15. Approximately 10 cells are red.
* **Type 4:** Red cells from Length 0 to Length 3, and Length 13 to Length 15. Approximately 6 cells are red.
* **Type 5:** Red cells from Length 5 to Length 7, and Length 13 to Length 15. Approximately 6 cells are red.
* **Type 6:** Red cells from Length 0 to Length 8. Approximately 9 cells are red.
* **Type 7:** Red cells from Length 0 to Length 8. Approximately 9 cells are red.
### Key Observations
* Types 6 and 7 have the longest continuous stretches of red cells, indicating a strong presence for lengths up to 8.
* Type 3 has a bimodal distribution, with red cells from 0-7 and then again from 13-15.
* Types 1, 2, 4, and 5 have more limited ranges of lengths where they are present.
* Lengths 13, 14, and 15 show a concentration of red cells across multiple types.
### Interpretation
The heatmap suggests a correlation between "Length" and "Type". The data indicates that certain "Types" are more prevalent at shorter "Lengths" (e.g., Types 1, 2, 4, 5), while others (Types 6, 7) extend to longer "Lengths". The bimodal distribution of Type 3 suggests that it may represent a different underlying process or category. The concentration of red cells at lengths 13-15 could indicate a common feature or constraint that affects multiple types at those specific lengths.
Without further context, it's difficult to determine the exact meaning of "Length" and "Type". However, the heatmap provides a clear visual representation of their relationship, highlighting which combinations are more frequent and which are less common. This could be useful for identifying patterns, making predictions, or guiding further investigation.