## Heatmap Chart: Shorter Inferences
### Overview
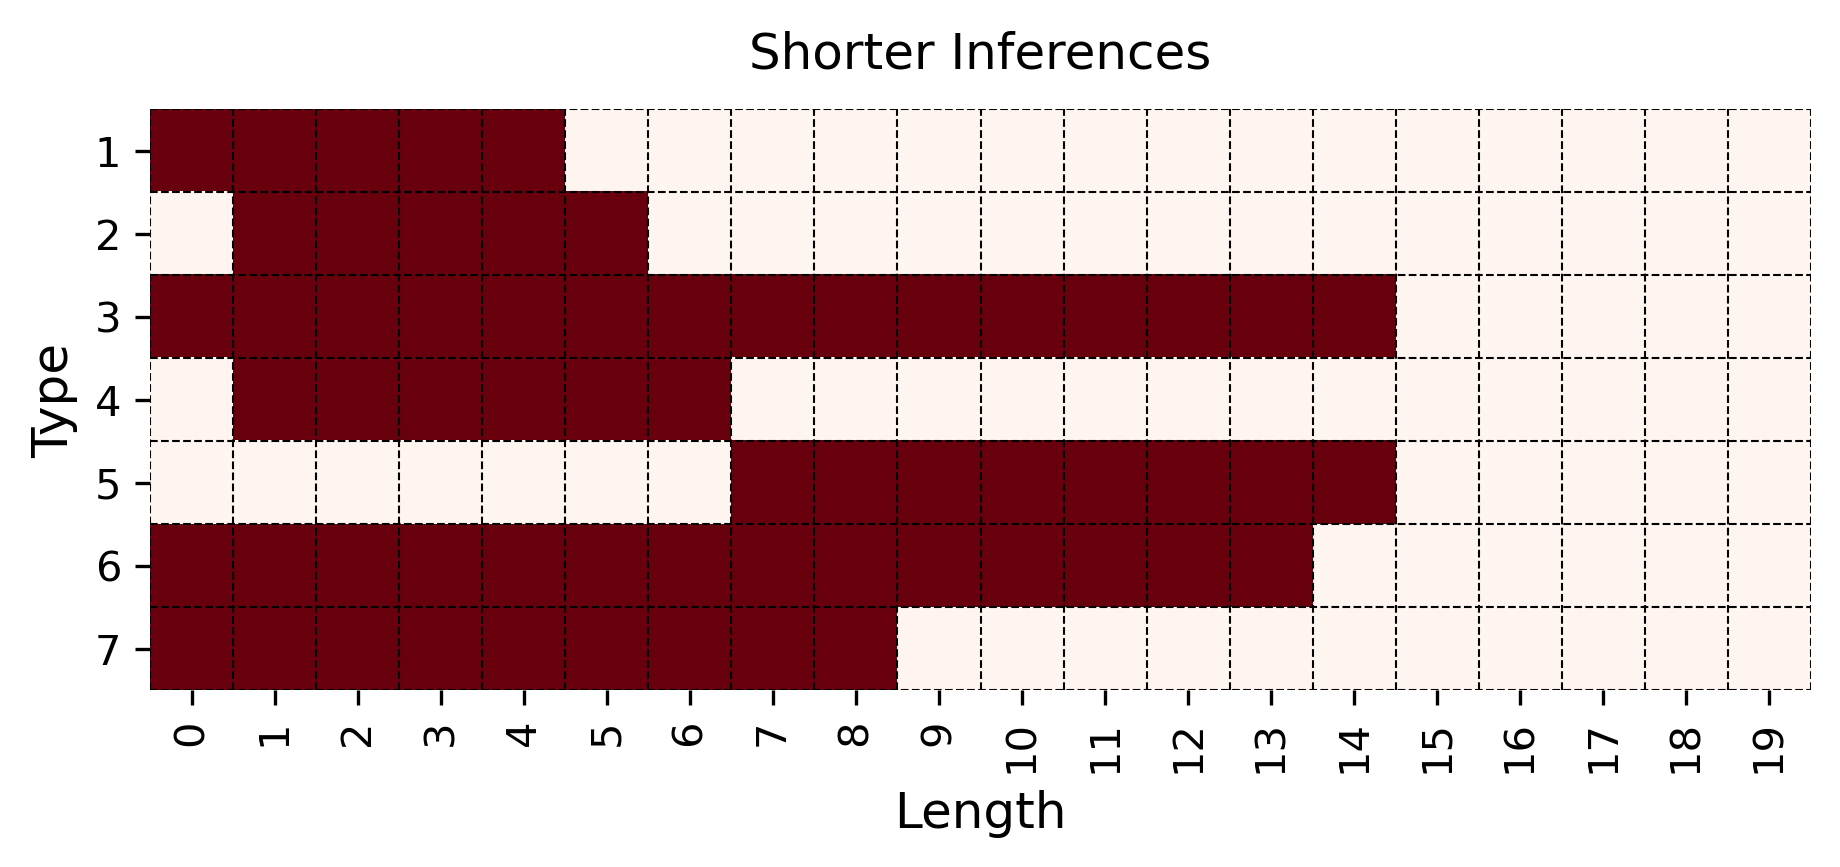
The image displays a heatmap titled "Shorter Inferences." It visualizes the presence or absence of seven distinct "Types" (vertical axis) across a range of "Lengths" (horizontal axis). The chart uses a two-color scheme: dark red indicates presence (or a positive value), and light beige indicates absence (or zero). The grid is marked with dashed lines for clarity.
### Components/Axes
- **Title**: "Shorter Inferences" (centered at the top).
- **Vertical Axis (Y-axis)**: Labeled "Type," with categorical markers numbered 1 through 7 from top to bottom.
- **Horizontal Axis (X-axis)**: Labeled "Length," with numerical markers from 0 to 19, incrementing by 1.
- **Color Legend**: Implied by the chart's visual encoding:
- **Dark Red**: Indicates the inference type is present or active at that specific length.
- **Light Beige**: Indicates the inference type is absent or inactive at that specific length.
- **Grid**: A dashed-line grid overlays the entire plot area, aligning with each integer value on both axes.
### Detailed Analysis
The heatmap presents a binary matrix where each cell corresponds to a specific (Type, Length) pair. The following table reconstructs the data, showing the range of lengths for which each Type is marked as present (dark red).
| Type | Length Range (Present) | Approx. Number of Lengths |
| :--- | :--------------------- | :------------------------ |
| 1 | 0 to 4 | 5 |
| 2 | 1 to 5 | 5 |
| 3 | 0 to 14 | 15 |
| 4 | 1 to 6 | 6 |
| 5 | 7 to 14 | 8 |
| 6 | 0 to 13 | 14 |
| 7 | 0 to 8 | 9 |
**Spatial Grounding & Trend Verification:**
- **Type 1 (Top Row)**: A solid dark red block spans from the left edge (Length 0) to Length 4. The trend is a short, continuous segment at the beginning of the length scale.
- **Type 2**: The first cell (Length 0) is light beige. A dark red block then spans from Length 1 to 5. The trend shows a one-unit delay before starting.
- **Type 3**: This is the longest continuous dark red block, extending from Length 0 to 14. It dominates the middle of the chart.
- **Type 4**: Similar to Type 2, the first cell (Length 0) is light beige. A dark red block spans from Length 1 to 6.
- **Type 5**: This row shows a significant delay. The first seven cells (Lengths 0-6) are light beige. A dark red block then spans from Length 7 to 14.
- **Type 6**: A long, continuous dark red block spans from Length 0 to 13, similar to but slightly shorter than Type 3.
- **Type 7 (Bottom Row)**: A dark red block spans from Length 0 to 8.
### Key Observations
1. **Variable Starting Points**: Not all types begin at Length 0. Types 2 and 4 start at Length 1, while Type 5 has the most delayed start at Length 7.
2. **Variable Durations**: The "length" of the present segment varies greatly. Type 3 has the longest duration (15 units), while Types 1 and 2 have the shortest (5 units each).
3. **Clustering at Lower Lengths**: Most types (1, 2, 3, 4, 6, 7) have their presence concentrated in the lower to middle range of the Length axis (0-14). No type is present beyond Length 14.
4. **Distinct Pattern for Type 5**: Type 5 is unique in having no presence in the first third of the length scale (0-6), suggesting a higher threshold or different condition for its activation.
### Interpretation
This heatmap likely illustrates the operational range or validity of different inference mechanisms ("Types") with respect to an input "Length" parameter. The data suggests:
- **Specialization**: Each inference type is specialized for a specific range of lengths. Type 3 and Type 6 are generalists, covering a broad spectrum. Type 5 is a specialist for mid-to-high lengths (7-14).
- **Activation Thresholds**: The delayed start for Types 2, 4, and especially 5 implies these inferences require a minimum input length to become active or relevant. This could relate to complexity, data sufficiency, or algorithmic constraints.
- **Upper Bound**: The consistent cutoff at or before Length 14 for all types indicates a system-wide maximum length for these "shorter inferences," beyond which they may not apply or a different mechanism takes over.
- **Functional Grouping**: The similar patterns of Types 1/2 and 3/6 might indicate they belong to related families or serve analogous purposes with slightly different parameters.
In essence, the chart maps the "territory" of seven different processes, showing where each one operates along a length dimension. It reveals a structured system where processes are activated and deactivated at specific points, likely to optimize performance or accuracy for different input sizes.