# Technical Document Analysis: "Shorter Inferences" Heatmap
## 1. **Title & Labels**
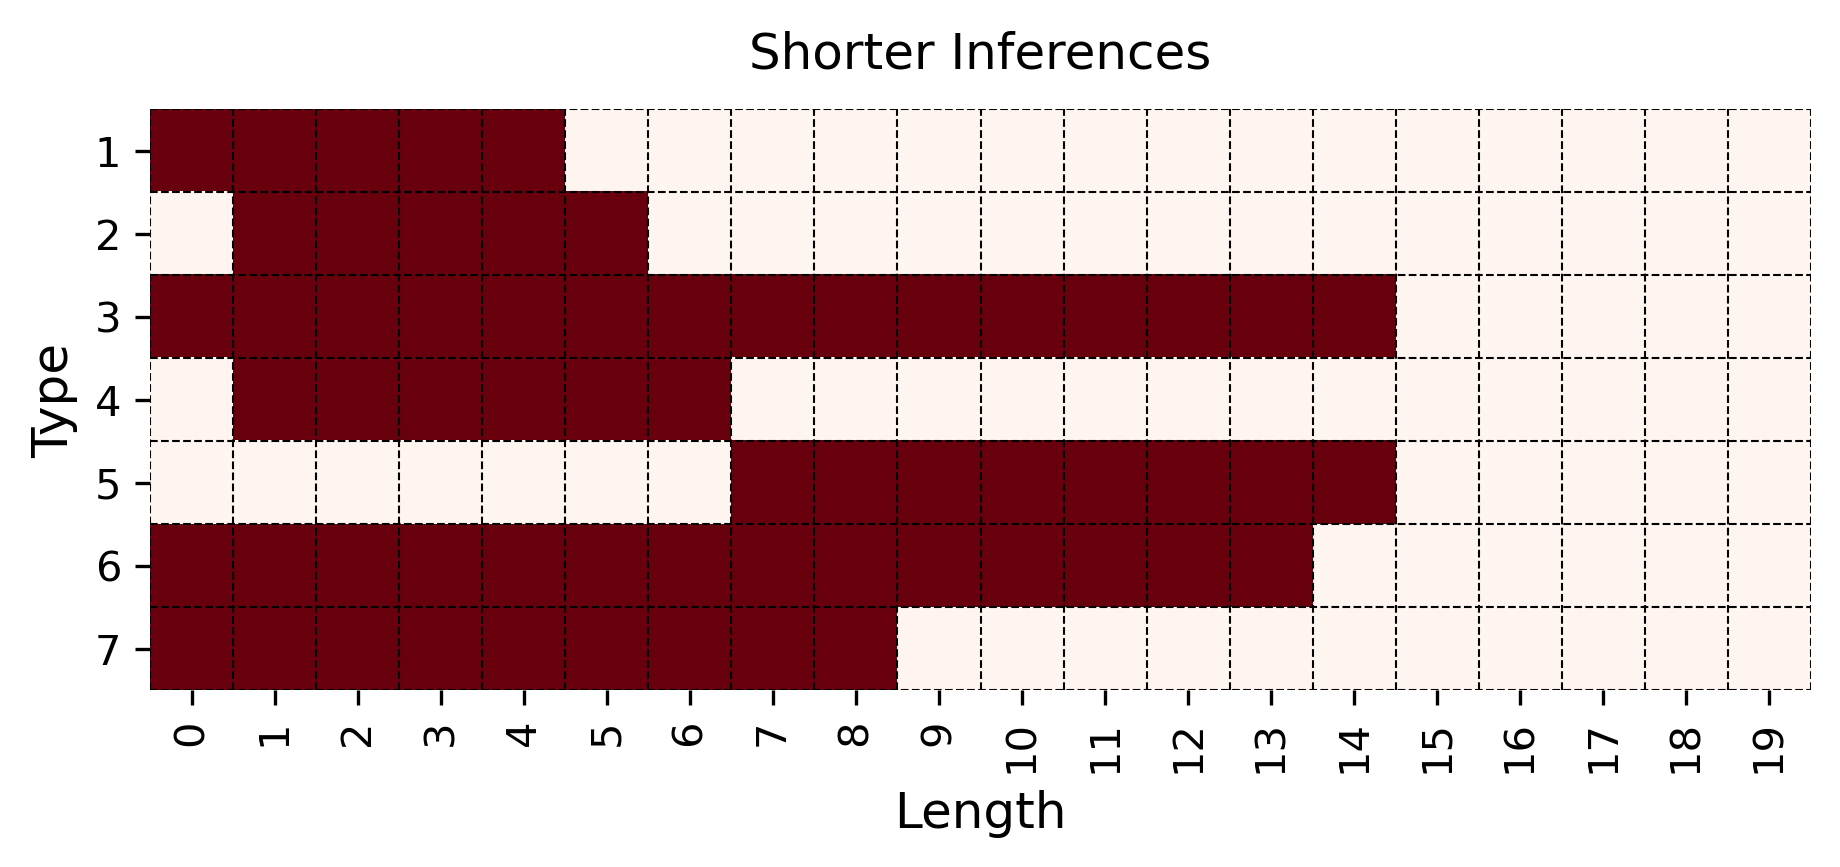
- **Title**: "Shorter Inferences"
- **X-Axis**: "Length" (numerical scale: 0 to 19)
- **Y-Axis**: "Type" (categorical scale: 1 to 7)
- **Legend**: Absent (no explicit color-key provided)
## 2. **Axis Markers**
- **X-Axis Markers**: Incremental values from 0 to 19 (evenly spaced).
- **Y-Axis Markers**: Incremental values from 1 to 7 (evenly spaced).
## 3. **Data Representation**
- **Color Coding**:
- **Red cells**: Indicate presence of data/inferences.
- **White cells**: Indicate absence of data/inferences.
- **Key Observations**:
- **Type 1**: Red cells span Length 0–5.
- **Type 2**: Red cells span Length 1–6.
- **Type 3**: Red cells span Length 0–14 (longest range).
- **Type 4**: Red cells span Length 1–7.
- **Type 5**: Red cells span Length 7–14.
- **Type 6**: Red cells span Length 0–13.
- **Type 7**: Red cells span Length 0–8.
## 4. **Trends**
- **Type 3** exhibits the broadest inference range (0–14), suggesting it is the most prevalent or versatile category.
- **Type 2 and Type 4** have the narrowest ranges (1–6 and 1–7, respectively), indicating limited applicability.
- **Type 5** shows a mid-range distribution (7–14), overlapping with Type 3 and Type 6.
- **Type 6** has a wide range (0–13), second only to Type 3.
## 5. **Missing Elements**
- **Legend**: No explicit explanation of red/white color meanings (e.g., "red = valid inference," "white = invalid").
- **Data Table**: No numerical values or metadata provided to quantify the heatmap.
## 6. **Spatial Grounding**
- **Legend Position**: Not applicable (legend absent).
- **Data Point Validation**: Red cells are consistently used across all types; no conflicting colors observed.
## 7. **Component Isolation**
- **Header**: Title "Shorter Inferences" (top-center).
- **Main Chart**: Heatmap occupying the majority of the image.
- **Footer**: No additional text or annotations.
## 8. **Conclusion**
The heatmap visualizes the distribution of "Shorter Inferences" across 7 types and lengths 0–19. Red cells highlight active data points, with Type 3 showing the widest range. The absence of a legend limits interpretability of color semantics.