## Bar Chart: AIME 2024 - Average Response Tokens vs. Thinking Budget
### Overview
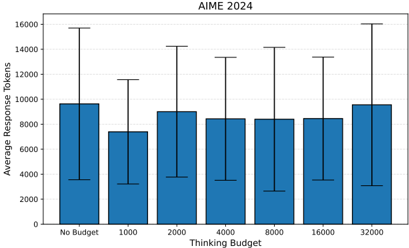
The image is a bar chart displaying the average response tokens against different thinking budgets for AIME 2024. The chart includes error bars indicating the variability in response tokens for each budget.
### Components/Axes
* **Title:** AIME 2024
* **Y-axis:** Average Response Tokens (scale from 0 to 16000 in increments of 2000)
* **X-axis:** Thinking Budget (categories: No Budget, 1000, 2000, 4000, 8000, 16000, 32000)
* **Bars:** Blue bars represent the average response tokens for each thinking budget.
* **Error Bars:** Black vertical lines extending above and below each bar, indicating the range of variability.
### Detailed Analysis
Here's a breakdown of the average response tokens for each thinking budget, along with the approximate range indicated by the error bars:
* **No Budget:** Average ~9700 tokens, range ~3500 to ~15800 tokens.
* **1000:** Average ~7400 tokens, range ~3200 to ~11600 tokens.
* **2000:** Average ~9000 tokens, range ~3700 to ~14300 tokens.
* **4000:** Average ~8500 tokens, range ~3500 to ~13500 tokens.
* **8000:** Average ~8400 tokens, range ~3500 to ~14200 tokens.
* **16000:** Average ~8400 tokens, range ~3500 to ~13300 tokens.
* **32000:** Average ~9600 tokens, range ~3500 to ~15700 tokens.
### Key Observations
* The average response tokens are relatively consistent across different thinking budgets, ranging from approximately 7400 to 9700.
* The error bars are substantial, indicating a high degree of variability in response tokens for each budget.
* The "No Budget" and "32000" thinking budgets have slightly higher average response tokens compared to the other budgets.
### Interpretation
The data suggests that the thinking budget has a limited impact on the average response tokens for AIME 2024. While there are slight variations, the overall average remains relatively stable. The large error bars indicate that other factors, not captured by the thinking budget alone, significantly influence the response token count. The slight increase in average response tokens for "No Budget" and "32000" might suggest a threshold effect, where either no budget or a very high budget leads to slightly longer responses, but this difference is within the range of variability.