\n
## Bar Chart: AIME 2024 - Average Response Tokens vs. Thinking Budget
### Overview
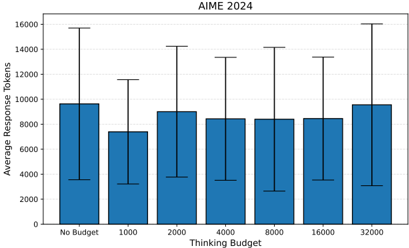
The image presents a bar chart illustrating the relationship between "Thinking Budget" and "Average Response Tokens" as of AIME 2024. Each bar represents the average number of tokens generated in response, with error bars indicating the variability around that average. The chart aims to show how providing different levels of "Thinking Budget" affects the length of the responses.
### Components/Axes
* **Title:** AIME 2024 (positioned at the top-center)
* **X-axis:** "Thinking Budget" with categories: "No Budget", "1000", "2000", "4000", "8000", "16000", "32000".
* **Y-axis:** "Average Response Tokens" ranging from 0 to 16000, with increments of 4000.
* **Bars:** Blue bars representing the average response tokens for each thinking budget.
* **Error Bars:** Black vertical lines extending above and below each bar, indicating the standard deviation or confidence interval.
### Detailed Analysis
The chart displays seven bars, each corresponding to a different "Thinking Budget" value. The height of each bar represents the average number of response tokens. The error bars show the spread of the data around each average.
* **No Budget:** The bar is approximately 9500 tokens tall. The error bar extends from roughly 3000 to 16000 tokens.
* **1000:** The bar is approximately 6500 tokens tall. The error bar extends from roughly 2000 to 11000 tokens.
* **2000:** The bar is approximately 8500 tokens tall. The error bar extends from roughly 3000 to 14000 tokens.
* **4000:** The bar is approximately 7500 tokens tall. The error bar extends from roughly 3000 to 12000 tokens.
* **8000:** The bar is approximately 7500 tokens tall. The error bar extends from roughly 3000 to 12000 tokens.
* **16000:** The bar is approximately 8000 tokens tall. The error bar extends from roughly 3000 to 13000 tokens.
* **32000:** The bar is approximately 9000 tokens tall. The error bar extends from roughly 3000 to 15000 tokens.
The trend is not strictly monotonic. The average response tokens initially decrease from "No Budget" to "1000", then increase to "2000", and remain relatively stable between "4000" and "16000", before increasing again at "32000".
### Key Observations
* The "No Budget" and "32000" thinking budgets yield the highest average response token counts.
* The "1000" thinking budget results in the lowest average response token count.
* The error bars are substantial for all budget levels, indicating high variability in response lengths.
* The error bars for "No Budget" and "32000" are particularly large, suggesting a wide range of possible response lengths for these budget levels.
### Interpretation
The data suggests that providing no budget or a large budget (32000) leads to longer average responses, but also greater variability in response length. A smaller budget (1000) results in shorter, more consistent responses. The relatively stable average response lengths between 4000 and 16000 suggest a saturation point where increasing the budget doesn't significantly impact the average response length.
The high variability, especially at the extremes, could indicate that the model's behavior is less predictable when given either complete freedom (no budget) or substantial resources (32000). The model might explore a wider range of response possibilities in these scenarios. The lower variability at 1000 suggests a more constrained and focused response generation process.
This data could be used to optimize the "Thinking Budget" parameter to achieve a desired balance between response length and consistency. For applications requiring concise responses, a lower budget might be preferable. For applications where detailed and comprehensive responses are needed, a higher budget might be more appropriate, but with the understanding that response lengths will be more variable.