## Bar Chart with Error Bars: AIME 2024 - Average Response Tokens vs. Thinking Budget
### Overview
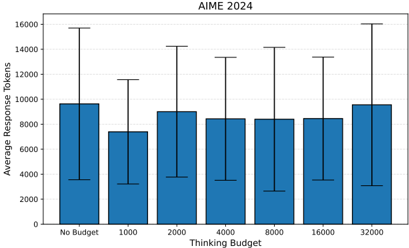
The image is a vertical bar chart titled "AIME 2024". It displays the relationship between a "Thinking Budget" (x-axis) and the "Average Response Tokens" (y-axis). Each bar represents a budget category and includes an error bar indicating the variability or range of the data.
### Components/Axes
* **Title:** "AIME 2024" (centered at the top).
* **Y-Axis:**
* **Label:** "Average Response Tokens" (rotated vertically on the left).
* **Scale:** Linear scale from 0 to 16000, with major tick marks at intervals of 2000 (0, 2000, 4000, 6000, 8000, 10000, 12000, 14000, 16000).
* **X-Axis:**
* **Label:** "Thinking Budget" (centered at the bottom).
* **Categories (from left to right):** "No Budget", "1000", "2000", "4000", "8000", "16000", "32000".
* **Data Series:** A single series of blue bars. Each bar has a black error bar extending above and below the top of the bar.
* **Legend:** No separate legend is present; the single data series is implied by the uniform blue color of all bars.
### Detailed Analysis
**Trend Verification:** The height of the bars (average tokens) does not follow a simple monotonic trend. It starts relatively high for "No Budget", dips to its lowest point at "1000", and then generally increases as the thinking budget grows from 2000 to 32000, though not perfectly linearly. The error bars are substantial for all categories, indicating high variance in the data.
**Approximate Data Points (Visual Estimation):**
* **No Budget:** Bar height ≈ 10,000 tokens. Error bar range ≈ 3,800 to 15,800.
* **1000:** Bar height ≈ 7,500 tokens (the lowest average). Error bar range ≈ 3,200 to 11,800.
* **2000:** Bar height ≈ 9,200 tokens. Error bar range ≈ 3,800 to 14,200.
* **4000:** Bar height ≈ 8,800 tokens. Error bar range ≈ 3,800 to 13,800.
* **8000:** Bar height ≈ 8,800 tokens. Error bar range ≈ 2,800 to 14,200.
* **16000:** Bar height ≈ 8,800 tokens. Error bar range ≈ 3,800 to 13,800.
* **32000:** Bar height ≈ 10,000 tokens (similar to "No Budget"). Error bar range ≈ 3,200 to 16,000 (the widest range).
### Key Observations
1. **Non-Linear Relationship:** The average response token count is not a simple function of the thinking budget. The introduction of a small budget (1000) correlates with a notable decrease in average tokens compared to having no budget constraint.
2. **High Variability:** The error bars are very large relative to the bar heights, often spanning a range of 8,000-12,000 tokens. This suggests the underlying data for each category has a wide distribution, and the averages may not be highly precise.
3. **Recovery at Higher Budgets:** After the dip at 1000, the average token count recovers and stabilizes between 2000 and 16000, before rising again at 32000 to a level comparable to the "No Budget" condition.
4. **Maximum Variance:** The "32000" budget category shows the largest error bar, indicating the greatest uncertainty or spread in the response token counts for that condition.
### Interpretation
The chart likely comes from an evaluation of an AI model's performance on the AIME (American Invitational Mathematics Examination) 2024, where "Thinking Budget" may refer to a constraint on computational steps, tokens, or time allocated for reasoning before generating a final answer.
The data suggests a complex trade-off. Imposing a very tight budget (1000) may force the model to produce shorter, potentially less reasoned responses, lowering the average token count. As the budget increases, the model has more capacity for internal "thinking," which may lead to longer, more elaborate solution paths, increasing the token count. The "No Budget" condition, representing the model's default behavior, produces lengthy responses on par with the highest budget.
The enormous error bars are a critical finding. They imply that for any given budget, the model's response length is highly inconsistent. This could be due to varying problem difficulty, the model's stochastic nature, or the budget constraint interacting unpredictably with the reasoning process. The high variance at the 32000 budget is particularly notable, suggesting that with ample resources, the model's behavior becomes even more unpredictable, sometimes producing extremely long responses.
In summary, the chart demonstrates that constraining a model's "thinking" budget has a non-monotonic effect on its output length and introduces significant variability. The optimal budget for consistent, moderate-length reasoning is not immediately clear from this data alone, as averages are overshadowed by variance.