## Stacked Bar Chart: Reyes Heslop Consulting Profits
### Overview
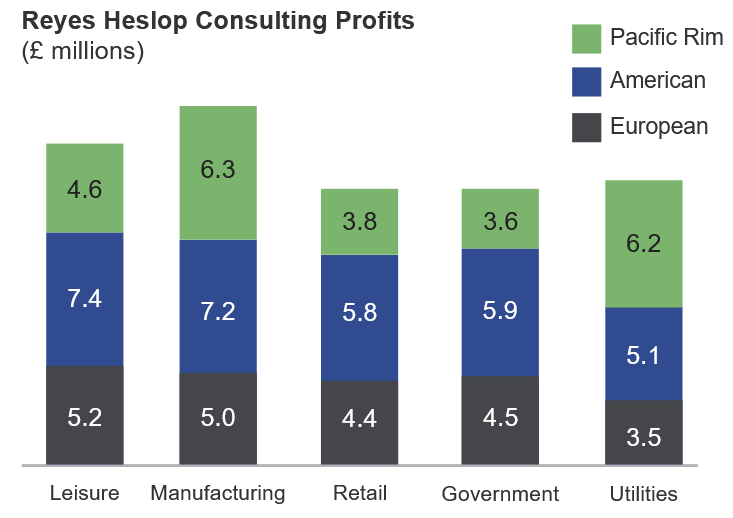
The image displays a stacked bar chart illustrating the profit distribution for "Reyes Heslop Consulting" across five distinct industry sectors. The data is segmented by three geographic regions: Pacific Rim, American, and European. The values are expressed in millions of pounds (£).
### Components/Axes
* **Title:** "Reyes Heslop Consulting Profits (£ millions)" located at the top left.
* **X-Axis (Categories):** Five industry sectors listed horizontally: Leisure, Manufacturing, Retail, Government, Utilities.
* **Legend:** Located at the top right, defining the color-coding for the stacked segments:
* **Green:** Pacific Rim
* **Blue:** American
* **Dark Grey:** European
* **Y-Axis:** Implicitly represents profit in £ millions. The values are embedded directly within each colored segment of the bars.
### Detailed Analysis
The following data points are extracted from the chart, organized by sector. The segments are stacked from top to bottom as Pacific Rim (Green), American (Blue), and European (Dark Grey).
| Sector | Pacific Rim (Green) | American (Blue) | European (Dark Grey) | Total Profit (£m) |
| :--- | :--- | :--- | :--- | :--- |
| **Leisure** | 4.6 | 7.4 | 5.2 | 17.2 |
| **Manufacturing** | 6.3 | 7.2 | 5.0 | 18.5 |
| **Retail** | 3.8 | 5.8 | 4.4 | 14.0 |
| **Government** | 3.6 | 5.9 | 4.5 | 14.0 |
| **Utilities** | 6.2 | 5.1 | 3.5 | 14.8 |
**Trend Verification:**
* **Pacific Rim (Green):** Shows high volatility. It peaks in Manufacturing (6.3) and Utilities (6.2), but drops significantly in Government (3.6) and Retail (3.8).
* **American (Blue):** Generally the highest contributor across most sectors. It shows a downward trend from Leisure (7.4) and Manufacturing (7.2) down to Utilities (5.1).
* **European (Dark Grey):** Shows the most stability, generally hovering between 3.5 and 5.2. It is consistently the lowest contributor in three out of five categories (Leisure, Manufacturing, Utilities).
### Key Observations
* **Highest Profit Sector:** Manufacturing is the most profitable sector overall (£18.5m), driven largely by strong performance in the Pacific Rim and American regions.
* **Lowest Profit Sectors:** Retail and Government are tied for the lowest overall profit (£14.0m each).
* **Regional Dominance:**
* The **American** region is the primary profit driver for Leisure, Manufacturing, Retail, and Government.
* The **Pacific Rim** region is the primary profit driver only in the Utilities sector.
* The **European** region never holds the top profit position in any sector.
### Interpretation
The data suggests that Reyes Heslop Consulting is heavily reliant on the American market for the majority of its revenue streams. The American region provides the most consistent performance across all sectors.
The Pacific Rim region exhibits a "bimodal" performance: it is highly successful in industrial/infrastructure-heavy sectors (Manufacturing and Utilities) but underperforms in service/public-sector-heavy areas (Retail and Government). This could indicate a specialization or a specific competitive advantage in the Pacific Rim for industrial consulting.
Conversely, the European region appears to be a steady, secondary contributor. It acts as a "floor" for the company's profits, rarely reaching the highs of the American or Pacific Rim segments, but maintaining a consistent presence. The company might consider investigating why the Pacific Rim underperforms in the Government and Retail sectors compared to the other regions, as this represents a significant gap in their portfolio.